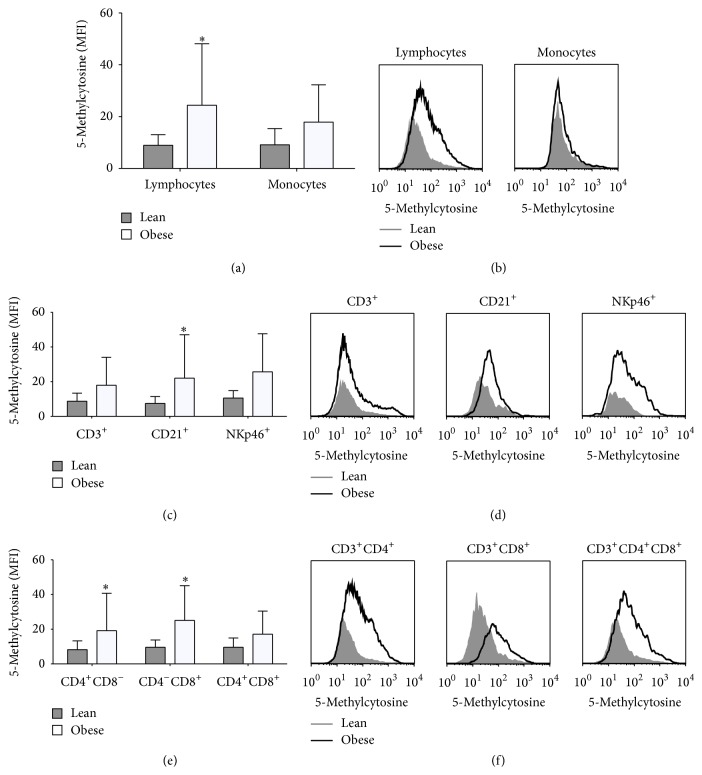
Figure 4.
Global DNA methylation in PBMCs subpopulations from lean (grey columns and histograms) and obese pigs (open columns and histograms). (a) Representative quantification of 5-methylcytosine levels in lymphocytes and monocytes. (b) Quantification of 5-methylcytosine levels (MFI) in lymphocytes and monocytes. (c) Representative quantification of 5-methylcytosine levels in T-cells (CD3+), B-cells (CD21+), and natural killer cells (NKp46+). (d) Quantification of 5-methylcytosine levels (MFI) in T-cells, B-cells, and natural killer cells. (e) Representative quantification of 5-methylcytosine levels in T-cells subpopulations: T-helper (CD3+CD4+), T-cytotoxic (CD3+CD8+), and double positive T-cells (CD3+CD4+CD8+). (f) Quantification of 5-methylcytosine levels (MFI) in T-helper, T-cytotoxic, and double positive T-cells. Data are mean ± SD. ∗ p < 0.05. MFI: median fluorescence intensity.

