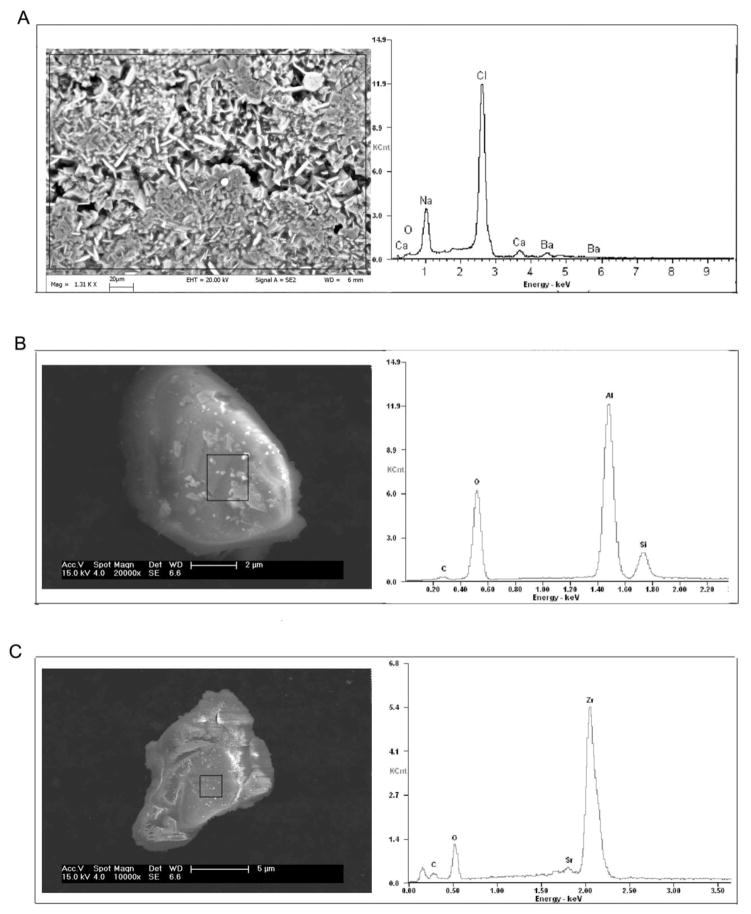
Figure 1.
SEM/EDX analysis of Marcellus flow back water. Representative SEM images reveal the morphology of crystals and particles in flow back samples. The rectangles indicate the regions that were analyzed by the EDX for the composition of the particulates. Samples were prepared at high (A) and low densities (B, C). At low density conditions, individual particles can be isolated and EDX can be performed on each particle.

