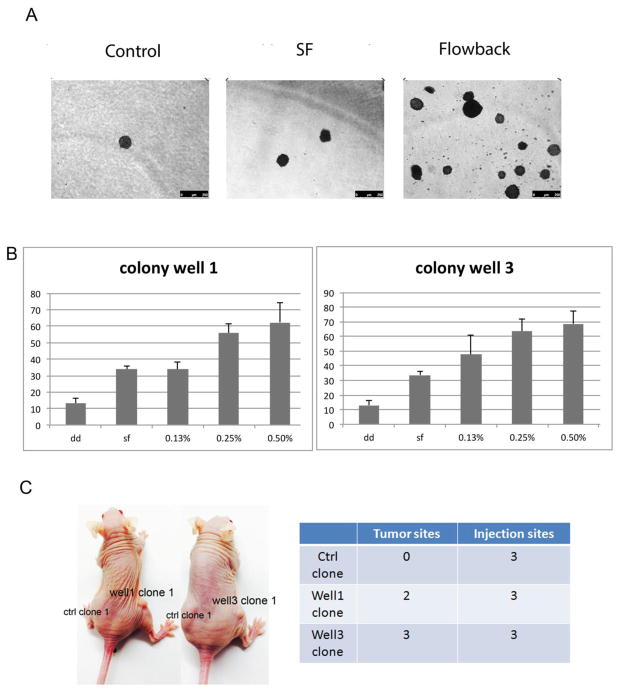
Figure 3.
Anchorage free growth of BEAS-2B cells exposed to Marcellus flow back. BEAS-2B cells were exposed to various concentrations of flow back for 6 weeks, and assessed for anchorage free growth using a soft agar assay. 3w later, cell colonies were stained with INT/BCIP and photographed. Panel A shows representative plates in soft agar assay, control: distilled water, SF: filtered pristine lake water from Sterling Forest. Numbers of colonies formed by BEAS-2B cells exposed to flow back well 1 and flow back well 3 (B) were counted and presented as the mean ± SD (n = 3), dd: distilled water, SF: filtered pristine lake water from Sterling Forest. Panel C shows representative image and the actual number of tumor formation in nude mice after subcutaneously injection of control clones (ctrl clone 1) and flow back water well 1-transformed cells (Well1 clone 1) and flow back water well 3-transformed cells (Well3 clone 1).

