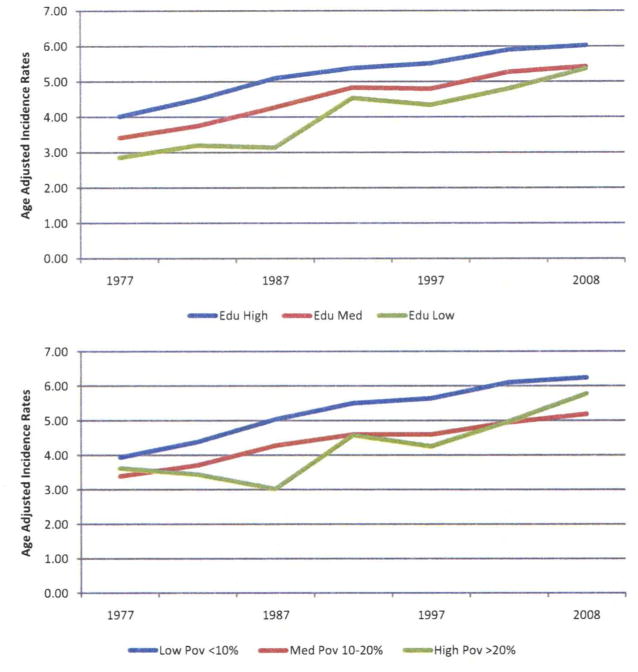
Fig. 1.
Trends in testicular cancer incidence by county socioeconomic measures*, Surveillance, Epidemiology, and End Results (SEER) (9 registries), data, 1975–2008. Rates were calculated as 5-year moving averages and were age-adjusted to the 2000 U.S. standard population. Data were released in April 2011 and based on the November 2010 submission (http://www.seer.cancer.gov/resources/). *Educational attainment: Low is defined as ≥25% of men without a high school diploma. Medium is defined as 15%–24.9% of men without a high school diploma. High is defined as <15% of men without a high school education. Poverty: High is defined as ≥20% of individuals below the poverty level. Medium is defined as 10%–20% of individuals below the poverty level. Low is defined as <10% of individuals below the poverty level. (Color version of figure is available online).

