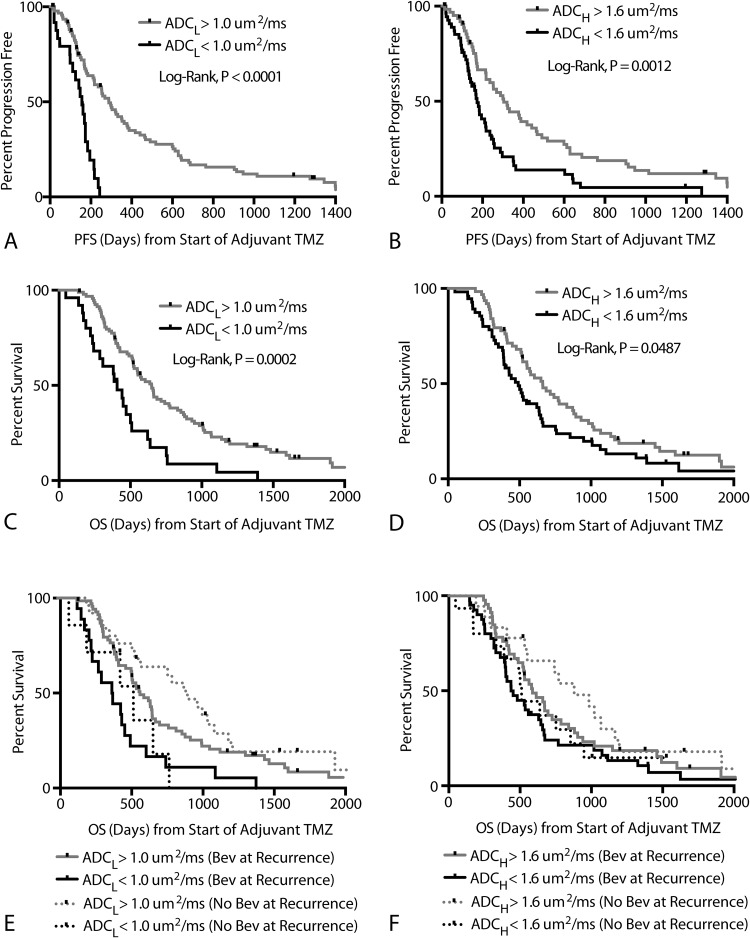
Figure 4.
Progression-free and overall survival. (A) Kaplan-Meier curves showing significantly lower PFS in patients with ADCL < 1.0 μm2/ms (log-rank, P < .0001; Cox multivariate, P = .0002). (B) Kaplan-Meier curves showing significantly lower PFS in patients with ADCH < 1.6 μm2/ms in univariate analysis (log-rank, P = .0012); however, ADCH was not significant in multivariate analysis (Cox multivariate, P = .9498). (C) Kaplan-Meier curves showing significantly lower OS in patients with ADCL < 1.0 μm2/ms (log-rank, P = .0002; Cox multivariate, P = .0487). (D) Kaplan-Meier curves showing significantly lower OS in patients with ADCH < 1.6 μm2/ms in univariate analysis (log-rank, P = .0487) but not when accounting for age and ADCL (Cox multivariate, P = .5478). (E) Kaplan-Meier curves showing differences in OS based on ADCL higher or lower than 1.0 μm2/ms for both bevacizumab-naïve (log-rank, P = .0130) and bevacizumab-treated (log-rank, P = .0029) patients at recurrence. No differences in OS were observed between patients treated with bevacizumab and those who were not within high ADCL (log-rank, P = .1977) or low ADCL (log-rank, P = .8959) groups. (F) Kaplan-Meier curves showing no differences in OS based on ADCH higher or lower than 1.6 μm2/ms for both bevacizumab-naïve (log-rank, P = .1330) and bevacizumab-treated (log-rank, P = .1510) patients at recurrence.

