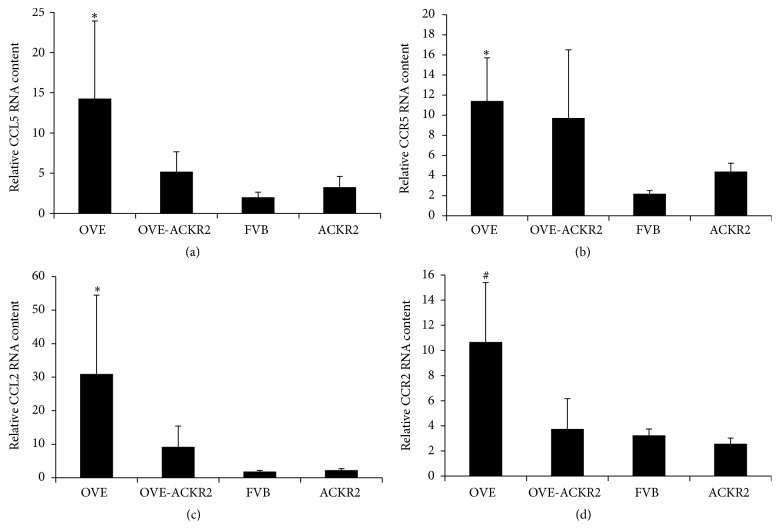
Figure 5.
Kidney RNA levels of ACKR2 ligands CCL2 and CCL5 and their receptors. Values were determined by RT-PCR with Taqman probes using 18S as standard. Columns are mean + SE. n = 3 OVE, 4 OVE-ACKR2, 5 ACKR2, and 6 FVB. ∗ indicates p ≤ 0.05 versus FVB and # indicates a trend of p ≤ 0.08 versus FVB. All determined by one-way ANOVA.

