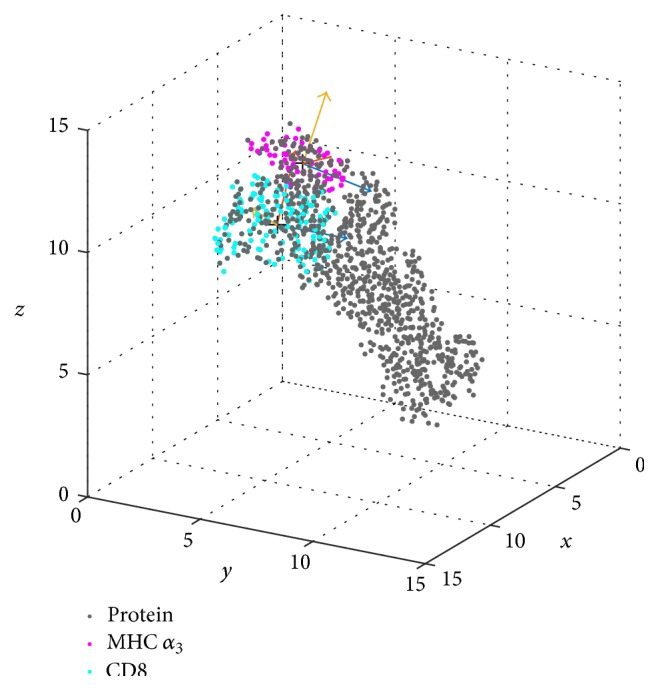
Figure 3.

Domains CD8 and MHC α 3 with local eigenvectors. Domain CD8 is shown in cyan, α 3 in purple, and the remaining parts of the MHC as well as the TCR (labelled “protein”) in black. Eigenvectors (v 1, v 2, v 3 and w 1, w 2, w 3, resp.) are shown for the first frame of the trajectory and colored (v 1, w 1: blue, v 2, w 2: red, v 3, w 3: yellow) for each of the domains.
