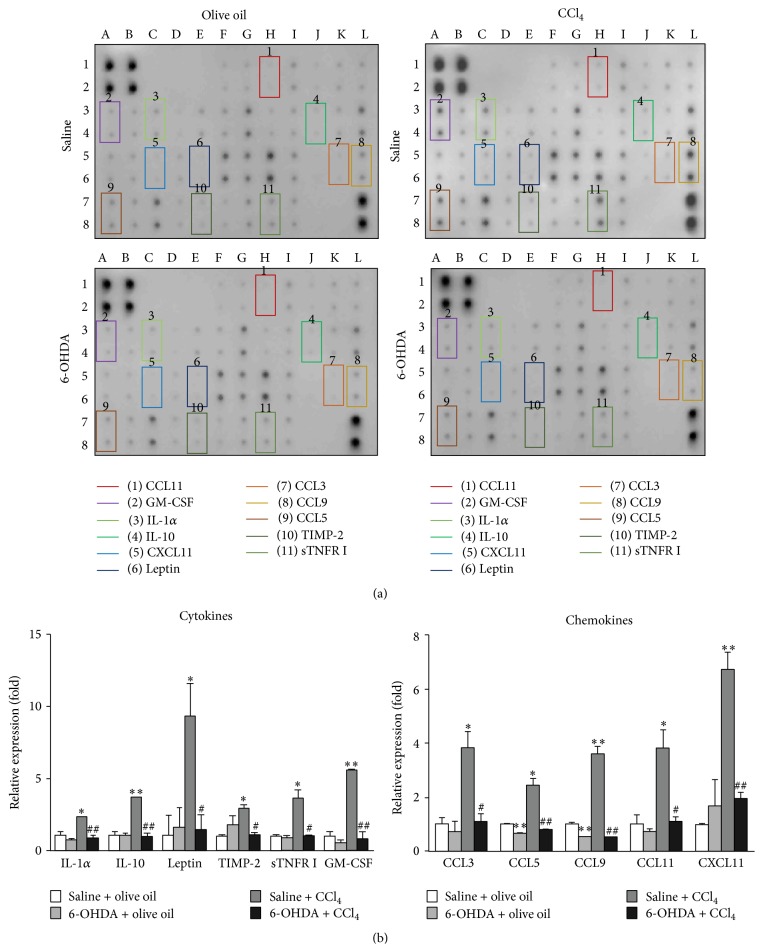
Figure 4.
Effect of 6-OHDA on levels of hepatic cytokines and chemokines in the absence and following CCl4 treatment. (a) A cytokine array assay in the liver of the saline + olive oil group, the 6-OHDA + olive oil group, the saline + CCl4 group, and the 6-OHDA + CCl4 group was measured. Altered cytokines (twofold or more), including IL-1α, IL-10, leptin, TIMP-2, sTNFR I, GM-CSF, CCL3, CCL5, CCL9, CCL11, and CXCL11, are indicated by boxes. (b) The relative density of cytokines and chemokines was normalized with the internal control and expressed as a ratio of the expression level of cytokines and chemokines in each group divided by the expression level in the saline + olive oil group. Each value represents the average of two replicated spots on the membrane. In all figures, ∗ denotes significant differences compared with the saline + olive oil group (p < 0.05). ∗∗ denotes significant differences compared with the saline + olive oil group (p < 0.01). # denotes significant differences compared with the saline + CCl4 group (p < 0.05). ## denotes significant differences compared with the saline + CCl4 group (p < 0.01).

