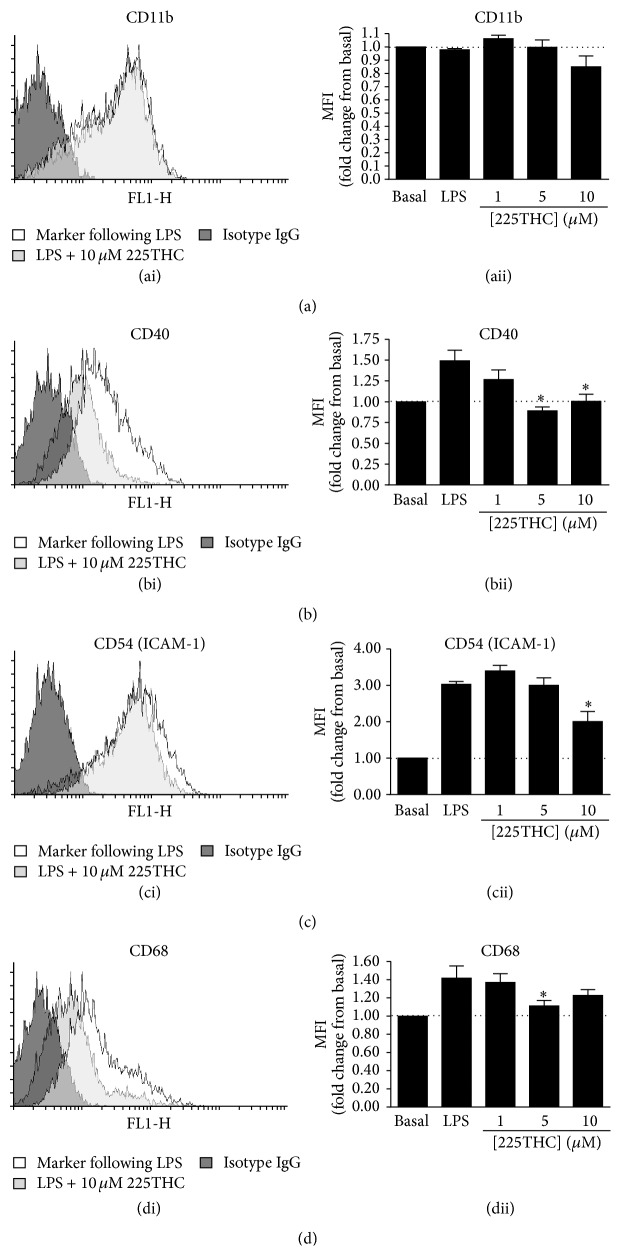
Figure 5.
225THC treatment modulates inflammatory cell surface marker expression in LPS-treated BV2 microglia. Flow cytometric analysis of 225THC-treated BV2 microglia following LPS stimulation. (a) Representative histogram plots of BV2 cell surface CD11b, CD40, CD54, and CD68 expression following 2 μg/mL LPS-treatment for 48 hours (unfilled histograms), versus isotype control (black-filled histograms), and in the presence of 10 μM 225THC (grey-filled histograms). (b) Summary data showing fold changes in CD11b, CD40, CD54, or CD68 expression by mean fluorescence intensity (MFI) from 4 independent experiments. Data are mean values ± SEM where ∗ indicates p < 0.05 by Student's t-test.

