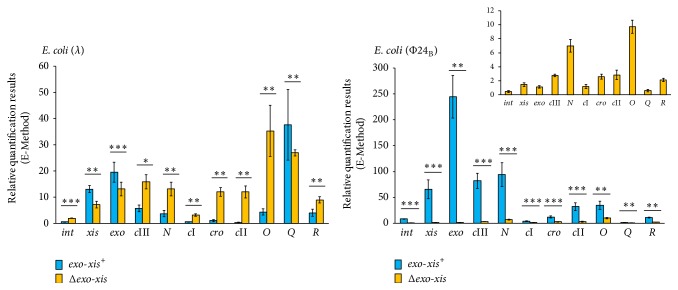
Figure 6.
Expression of selected bacteriophage genes in E. coli MG1655 lysogenic with λ or Φ24B, either wild-type (blue columns) or Δexo-xis (yellow columns) at 160 min after treatment with 1 mM H2O2, as estimated by reverse transcription quantitative real-time PCR. The values obtained with untreated cells were used as calibrators and were subtracted from the values determined at particular time points; thus, the presented values indicate the induction of expression of tested genes. The presented results are mean values from 3 independent experiments (biological samples), with error bars indicating SD. The additional panel for E. coli (24B) represents the results of Δexo-xis variant with different scale, due to very small values measured. Statistically significant differences (in t-test) are marked as follows: ∗ p < 0.05, ∗∗ p < 0.01, and ∗∗∗ p < 0.001.

