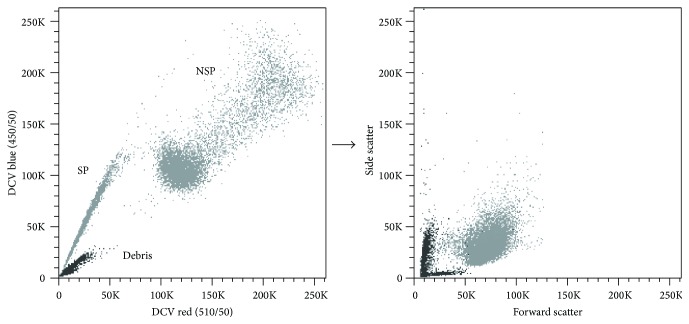
Figure 3.
Characteristic localization of debris close to the SP. A2780V cells were stained with 10 μM DCV (106 cells/mL) and analysed by flow cytometry. In this particular case, debris was not properly excluded in the initial forward/side scatter gate to illustrate its location relative to SP and NSP. Debris generally tends to generate a “smear population” in the lower left part of the plot that often shows overlap with the bona fide SP. Thus, debris exclusion by adequate forward/side scatter gating is really crucial in SP analysis.

