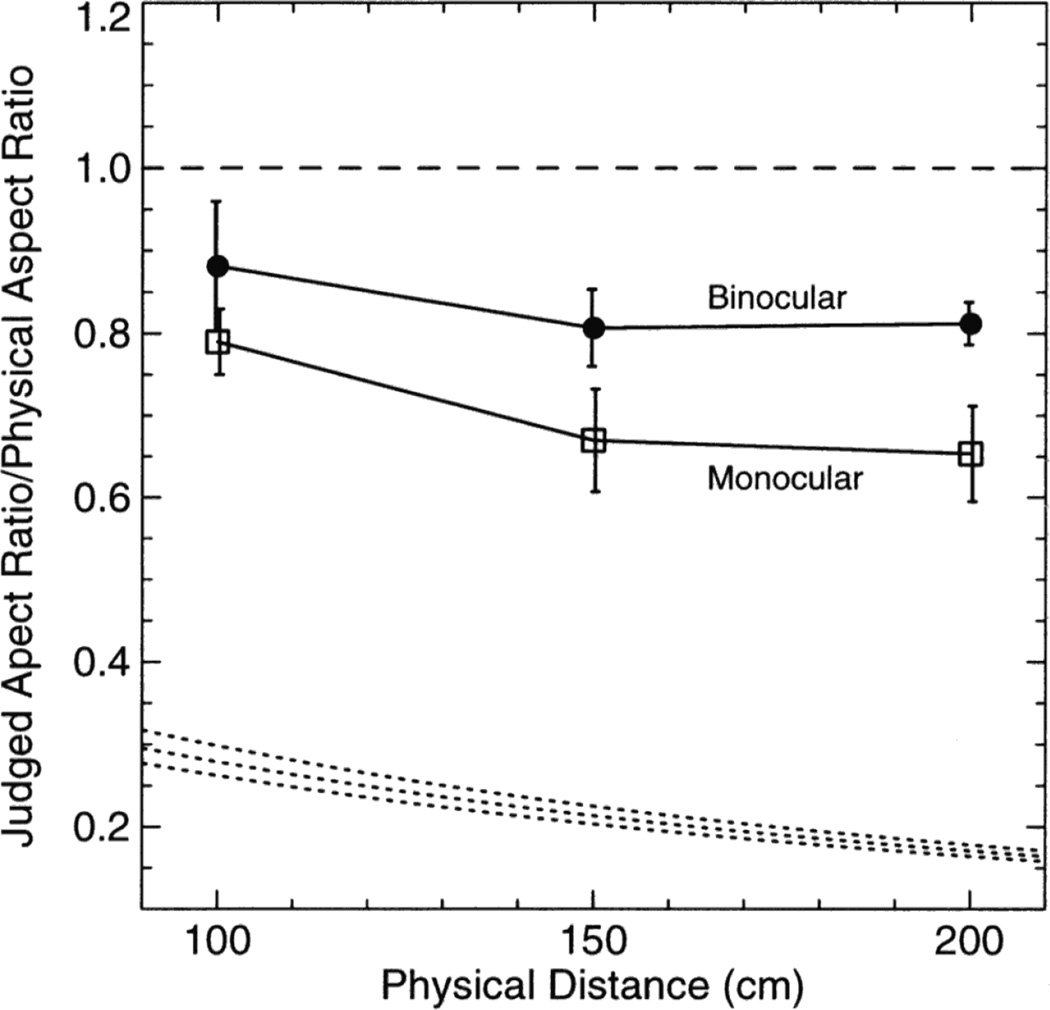
Figure 3.
Results of shape judgment task in Experiment 2. Mean normalized aspect ratio judgments (first session only) as a function of target distance and viewing condition. Filled symbols represent data from the binocular condition, and open symbols represent data from the monocular condition. Error bars denote. The dashed line gives the predicted response for veridical shape perception. The three dotted lines (corresponding to the 3 stimulus sizes) give the predicted responses if perceived shape were equal to retinal shape.

