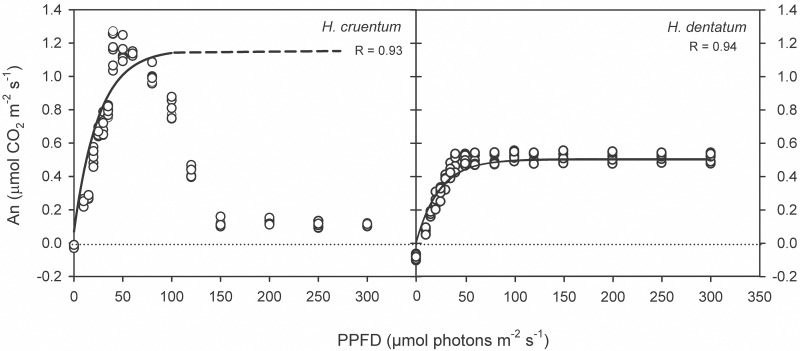
Fig 3. Dependency of CO2 net assimilation rate (An, μmol m-2 s-1) on Photosynthetic Photon Flux Density (PPFD, μmol photons m-2 s-1) in two filmy fern species with contrasting vertical distribution: Hymenoglossum cruentum and Hymenophyllum dentatum.
All replicates were plotted in the graph (n = 6). A black line indicates the fit curve for photosynthetic responses to light following Lambers et al. (2008) [31]. A dashed line indicates the portion of the fit curve where observed values for H. cruentum diverted from those expected values.

