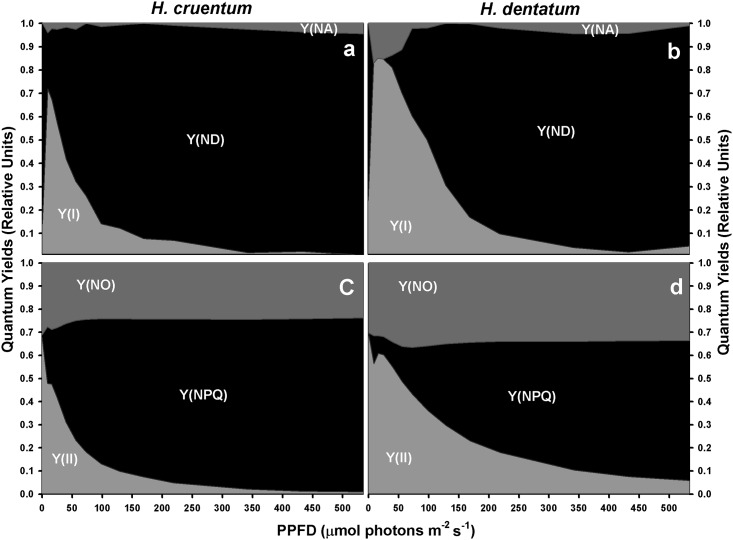
Fig 4. Changes in partitioning of absorbed excitation energy with increasing PPFD.
This was measured at PSI (a, b) and PSII (c, d) level in fronds of Hymenoglossum cruentum and Hymenophyllum dentatum. A dashed line indicates the portion of the curve where comparisons between species were made. These points correspond to the light saturation points of H. cruentum at 24.6 μmol photons m-2 s-1 (IsH.cru) and of H. dentatum at 40.5 μmol photons m-2 s-1 (IsH.den), both obtained from gas exchange measurements. Values are shown as mean ± SE (n = 4).

