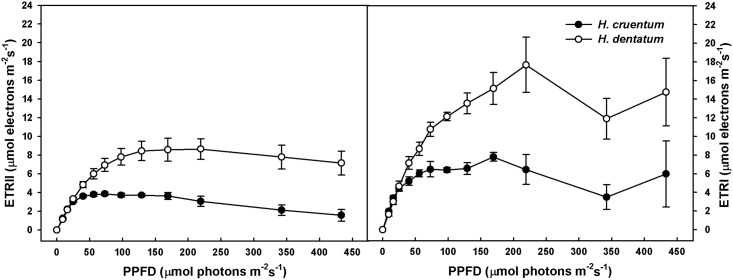
Fig 6. Light response curves of PSII (ETRII) and PSI (ETRI) electron transport rates in fronds of H. cruentum and H. dentatum.
Detached fronds were fully hydrated overnight and then dark adapted during 30 min. PPFD response curves were programmed using the scripting facility of the Dual-PAM 100 control software. Each frond was exposed to successively increasing actinic light levels (0 to 436 μmol photons m-2 s-1), with 3 min equilibration time at each light level before the application of saturating pulses. Values correspond to the mean ± SE (n = 4).

