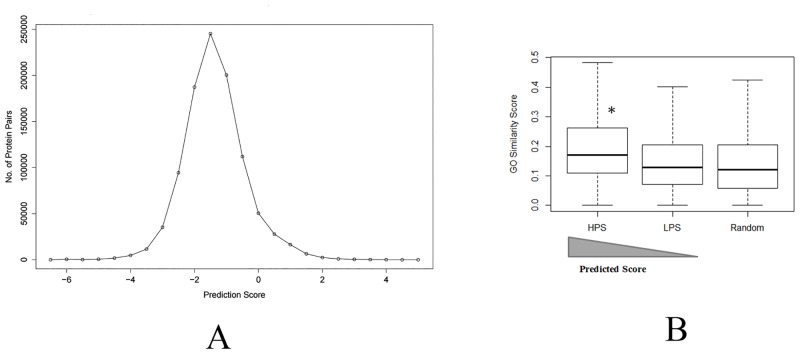
Fig 2.
A. Frequency plot of Salmonella Typhi protein pairs predicted scores. B. Box plots represent distribution of GO semantic similarity score vs. SVM prediction score. The x-axis and y-axis of box plots denotes the predicted scores and GO semantic similarity scores respectively. The bins HPS, LPS and Random represents highly predicted scores (Predicted score > 2), low predicted scores (Predicted score ~ -1.5) and random predicted scores (2.73 > Predicted score > -6.33) respectively. Median of each distribution is indicated by a horizontal bar in each box plot. The HPS has significantly (*) higher semantic similarity than LPS (Welch Two Sample t-test P value is 2.2 × 10⁻¹⁶) and Random (Welch Two Sample t-test P value is 2.2 × 10⁻¹⁶).

