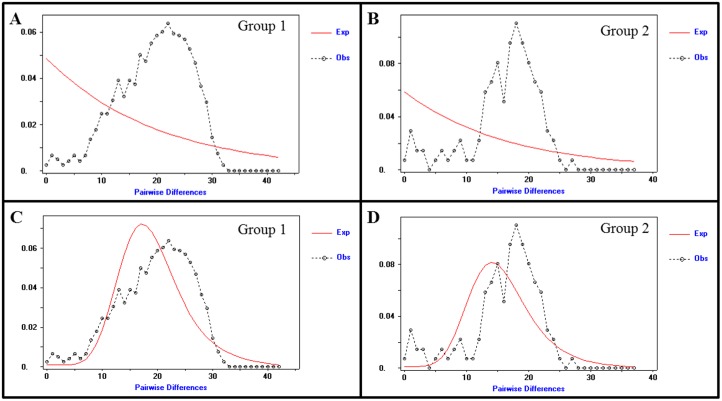
Fig 5. Bobwhite Historical Demography Inferred From Complete Mitogenome Sequences.
(A) The observed mismatch distribution (dashed line) for bobwhite Group 1 (n = 49) as compared to the expected distribution (red line) for a stable population (i.e., constant population size). (B) The observed mismatch distribution (dashed line) for bobwhite Group 2 (n = 17) as compared to the expected distribution (red line) for a stable population (i.e., constant population size). (C) The observed mismatch distribution (dashed line) for bobwhite Group 1 (n = 49) as compared to the expected distribution (red line) for a growth-decline model. (D) The observed mismatch distribution (dashed line) for bobwhite Group 2 (n = 17) as compared to the expected distribution (red line) for a growth-decline model.

