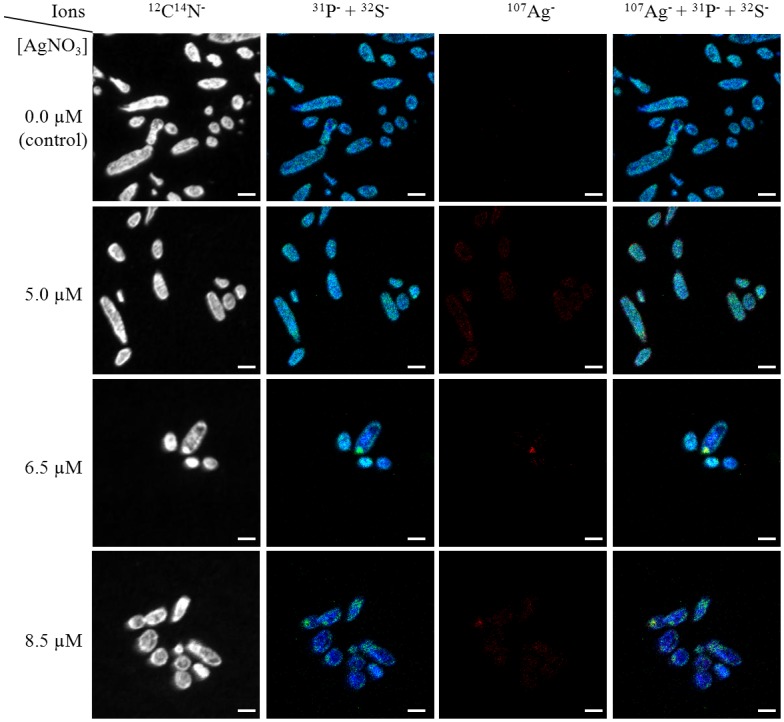
Fig 1. Distribution maps of CN (in grey), P (in blue), S (in green) and Ag (in red) elements detected by NanoSIMS analysis in E. coli cells after 3 h of culture without ionic silver (control) or in the presence of 5.0, 6.5 and 8.5 μM of AgNO3.

The fourth column corresponds to overlapping of the three-coloured images (Composite Image mode [23]). Scale bar: 2 μm.
