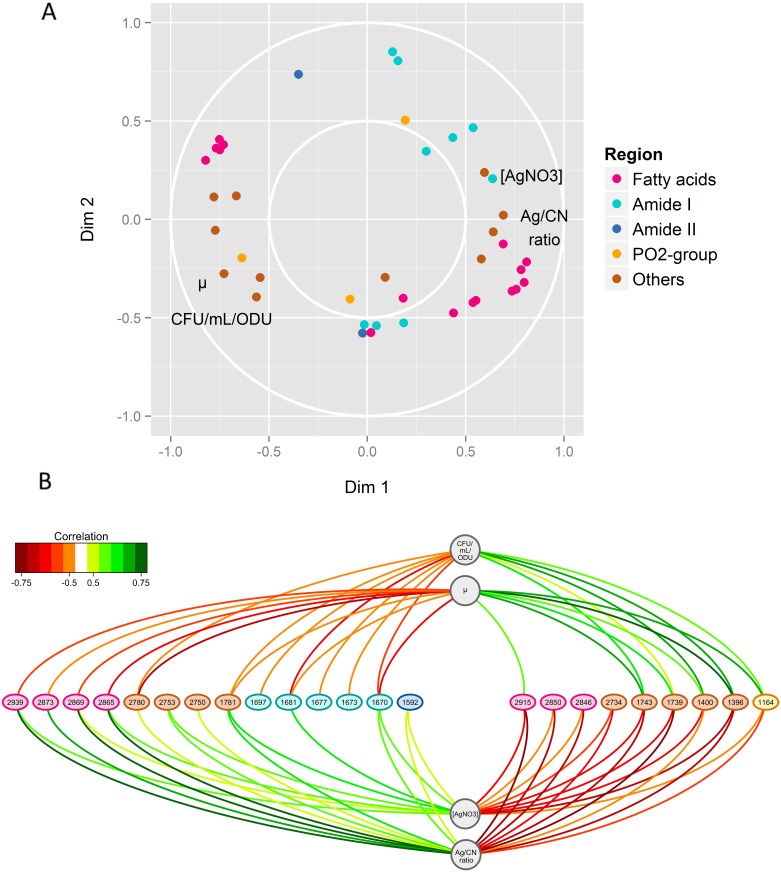
Fig 3. Results of the sPLSR integrative approach between the Y matrix, corresponding to AgNO3 concentrations and physiological parameters (i.e., specific growth rate μt = 3h, number of cultivable cells (CFU/mL/ODU) and intracellular silver content illustrated by the Ag/CN ratio at 3 h culture) and the X matrix composed of the selected sFTIR data (i.e. the regions 3,100–2,800 cm-1, 1,700–1,600 cm-1, 1,600–1,480 cm-1 and 1,300–1,150 cm-1, representative of fatty acids, C = O stretching vibration, amide I and amide II bands and PO2- groups and C-O stretching mode, respectively).
The regions 2,800–2,700 cm-1, 1,800–1,700 cm-1 and 1,480–1,300 cm-1 are grouped under “Others”. (A) Correlation circle plots for dimensions 1 and 2. The subsets of correlated wavenumbers are represented by thick points coloured according to the legend, while the physiological parameters are represented by their name in black. (B) Relevance networks resulting from the sPLSR approach. A threshold of 0.5 was used for relevant correlations. Green and red edges indicate positive and negative correlations, respectively. Physiological parameters and wavenumbers are represented as circles and ellipses, respectively.

