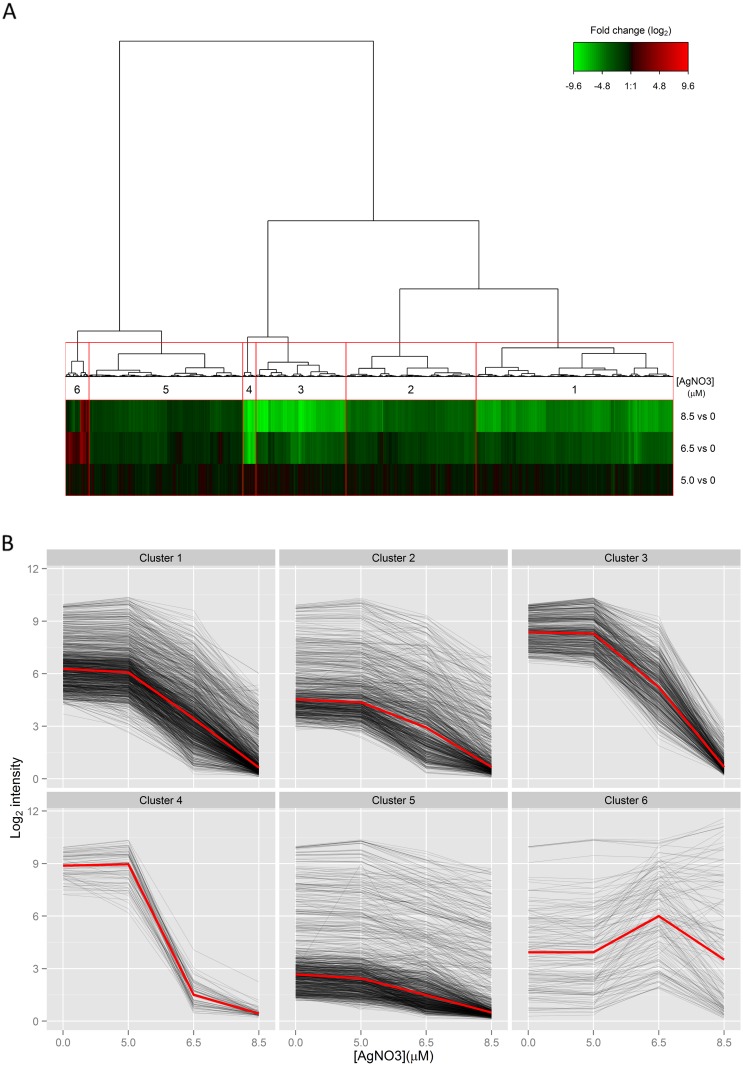
Fig 4. Ionic silver-mediated expression regulation.
(A) Hierarchical clustering of expression ratios between growth conditions with 5.0, 6.5 or 8.5 μM of AgNO3 in the medium and the control (i.e., no ionic silver added) for the 3,486 differentially-expressed genes in one of the three ionic-silver mediated stress conditions. The resulting heat map shows the samples in rows and the genes in columns, red indicates up-regulation, green down-regulation, and black no change. (B) The expression of genes in each cluster is plotted as a function of the concentration of AgNO3 in the medium to show the general trend of expression regulation. The red line in the individual clusters represents the median calculated from the expression levels of the genes. Cluster 1: 1,131 genes, cluster 2: 746 genes, cluster 3: 516 genes, cluster 4: 76 genes, cluster 5: 881 genes and cluster 6: 136 genes.

