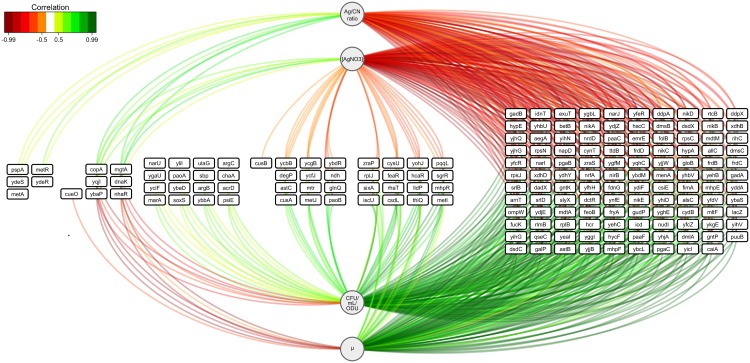
Fig 5. Relevance networks resulting from the sPLSR approach between the Y matrix corresponding to AgNO3 concentrations and physiological parameters (i.e., specific growth rate μt = 3h, number of cultivable cells (CFU/mL/ODU) and intracellular silver content illustrated by the Ag/CN ratio at 3 h culture) and the X matrix representing the expressions of the 3,486 differentially expressed genes in one of the three AgNO3-mediated stress growth conditions.
A threshold of 0.5 was used for relevant correlations. Green and red edges indicate positive and negative correlations, respectively. Physiological parameters are represented as circles and genes as rectangles.

