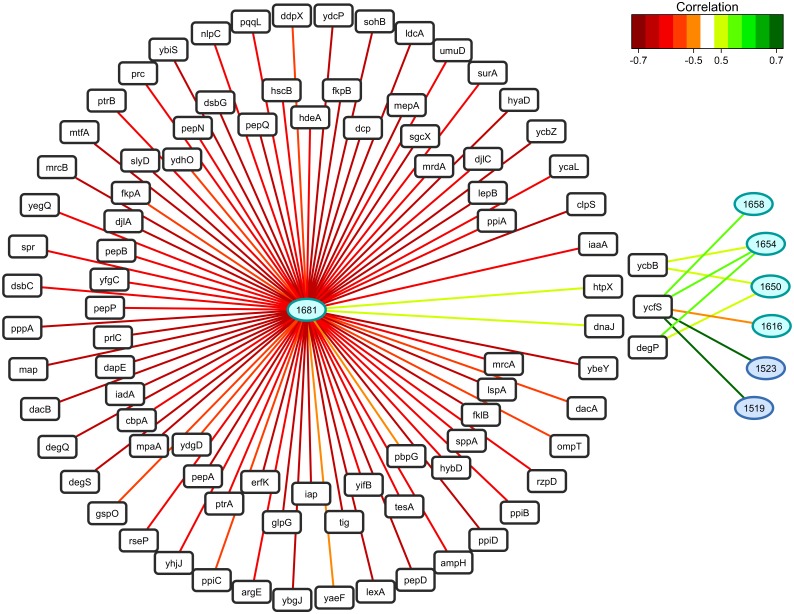
Fig 7. Relevance networks resulting from the sPLSR approach between the Y matrix composed of selected sFTIR data in the region of amide I and amide II (1,700–1,480 cm-1), and the X matrix corresponding to the expression of genes involved in protein folding.
The gene list was restricted to the 104 differentially-expressed genes annotated as chaperone (GO:0051087), peptidase (GO:0008233), heat shock protein (GO:0031072), peptidyl-prolyl isomerase (GO:0003755) and protein disulfide isomerase (GO:0003756). A threshold of 0.5 was used for relevant correlations. Green and red edges indicate positive and negative correlations respectively. Wavenumbers are represented as ellipses and genes as rectangles.

