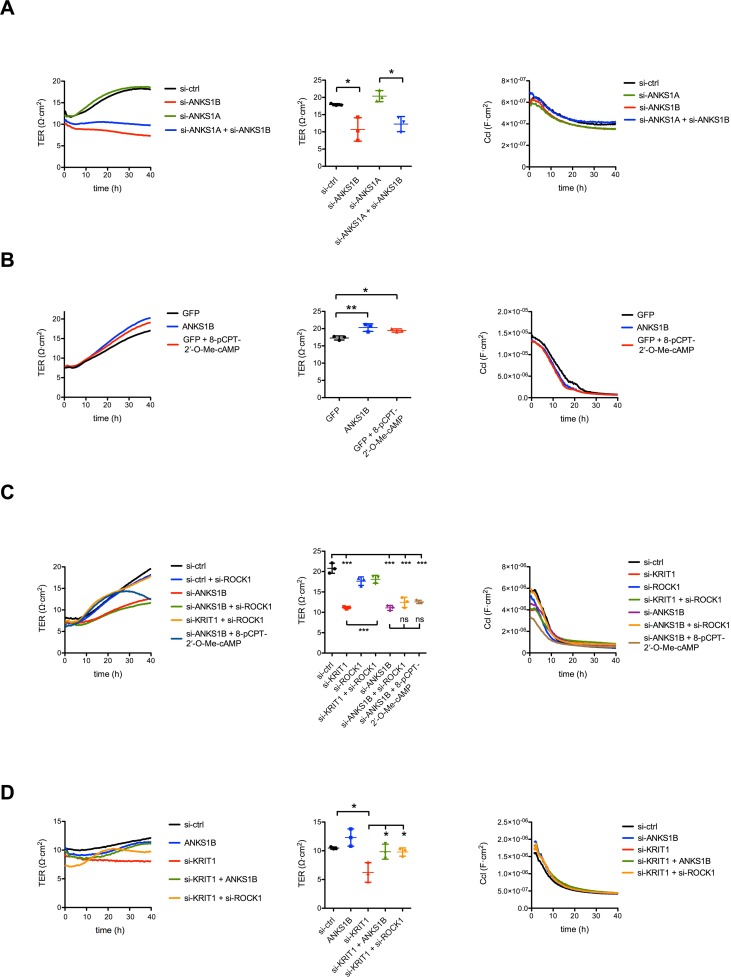
Fig 5. ANKS1B promotes endothelial cell permeability.
(A) Representative graphs of TER and Ccl measurement after ANKS1B- and ANKS1A-silencing via siRNA transfection, alone or in combination. Measurements with a second siRNA against ANKS1B showed comparable results. (B) Representative TER/Ccl measurement comparing ANKS1B overexpressing endothelial cells to GFP expressing +/- 5 μM cyclic AMP treated cells. Adenoviral overexpression of ANKS1B leads to a significantly increased electrical resistance in HUVEC comparable to values reached with cyclic AMP treatment. (C) Representative graphs of TER and Ccl measurement after ROCK1-, KRIT1- and ANKS1B-silencing via siRNA transfection, Knockdown of ROCK1 or addition of 8-pCPT-2′-O-Me-cAMP could not rescue the drop of electrical resistance due to ANKS1B silencing. In contrast silencing of ROCK1 lead to an rescue of almost 100% in KRIT1-silenced endothelial monolayers. (D) Representative graph of a transendothelial electrical resistance (TER) and the corresponding capacity (Ccl) measurement. Endothelial cells deficient of KRIT1 were treated with an adenovirus overexpressing ANKS1B. The increase of electrical resistance is comparable with KRIT1-deficient endothelial cells silenced for ROCK1. *, p < 0.05; **, p < 0.01, ***, p < 0.001, n = 3 experiments. Bar graphs show mean values, error bars indicate SD.

