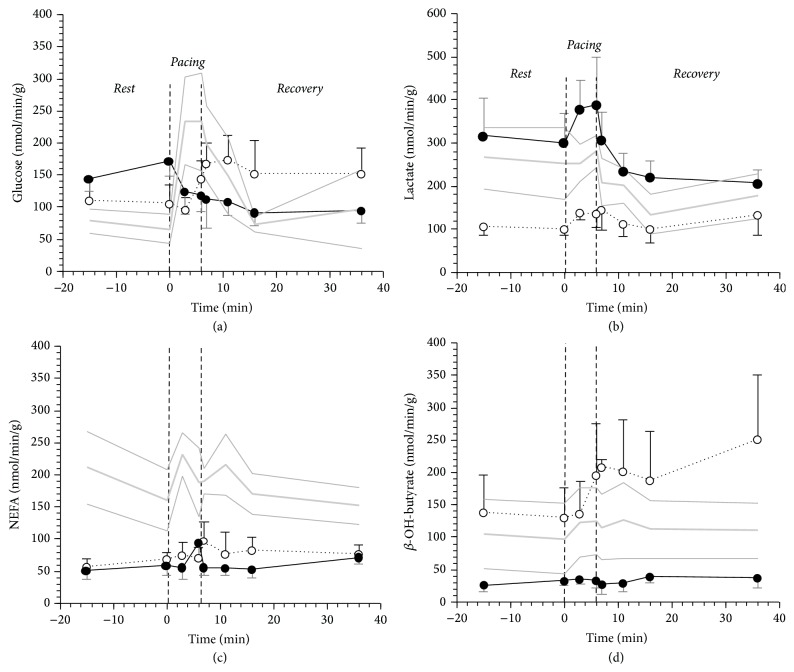
Figure 2.
Cardiac glucose (a), lactate (b), NEFA (c), and β-OH-butyrate (d) uptake in 5 N-AGT (gray line), 5 DCM-NGT (dotted black line), and 5 DCM-AGT (continuous black line) in the 3 phases of the study protocol: Rest, Pacing, and Recovery. The plotted values are mean ± SEM. The thin gray lines represent the SEM of the N-AGT group.

