
Fig. 2.
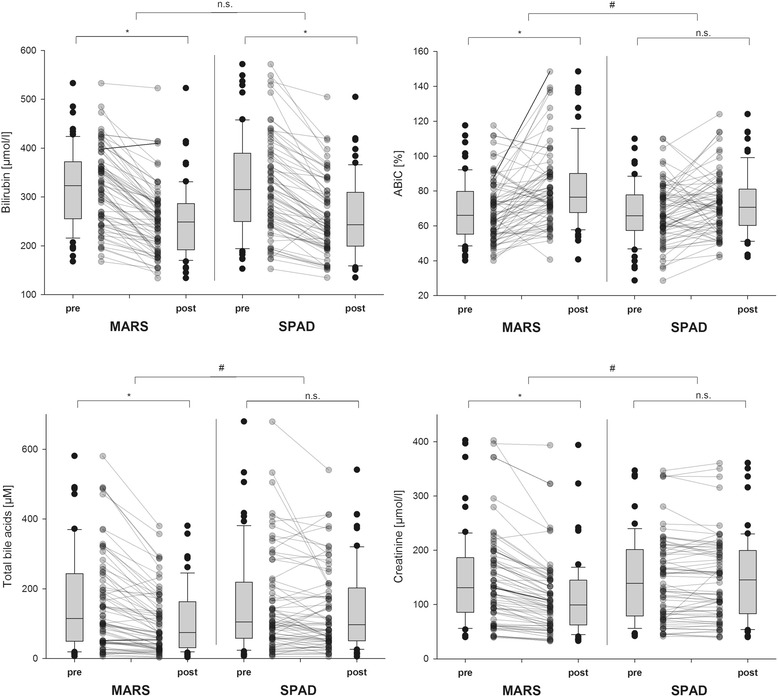
Changes in laboratory parameters representing the primary and secondary study endpoints. Total bilirubin levels, albumin-binding capacity (ABiC), total bile acid concentrations and creatinine levels during albumin dialysis, separated by the applied extracorporeal albumin dialysis (ECAD) systems Molecular Adsorbents Recirculating System (MARS) or single-pass albumin dialysis (SPAD). Box plots represent overall values including all 69 performed ECAD cycles, while bounded dots mark changes of each individual ECAD application. *p < 0.05 significant changes within ECAD; # p < 0.05 significant differences between both devices. n.s. non-significant difference