Figure 1.
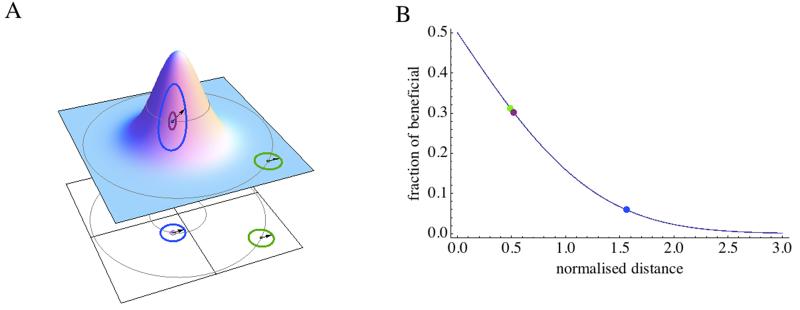
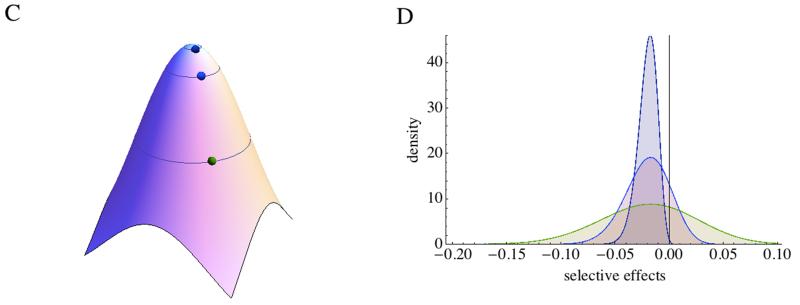
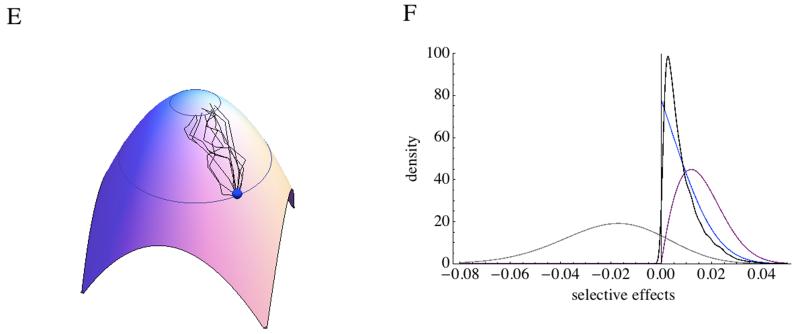
A) FGM fitness landscape, with fitness on the vertical axes and below the projection on a 2D plot. Fitness decays as the phenotype moves away from the optimal phenotype. Mutation of phenotypic size r moves the phenotype on a hyper-sphere. The same mutation (arrow) may have different effects depending on the initial phenotype. B) Fraction of beneficial mutations as a function of the scaled effect of mutation . The points represent the situations illustrated in A, assuming a 100 dimensions. A large r (blue) is less likely to be beneficial than a small r from the same phenotype (purple) or a mutation of similar r affecting a less optimal phenotype (green). C) The distribution of mutation effects on fitness depends on the initial position of the phenotype. D) The distribution is presented for the points presented in C assuming n = 20, and initial log-fitness of −0.01 (purple), −0.1 (blue) and −0.5 (green). E) Ten adaptive walks moving log-fitness from −0.1 to −0.01 are presented. F) Different distribution of mutation effects produced from a phenotype of log-fitness −0.1 are presented (other parameters as in D): total mutations (Gray), beneficial mutations (Blue), beneficial mutations surviving drift (Purple), mutations fixed during adaptive walks starting from that phenotype (Black).


