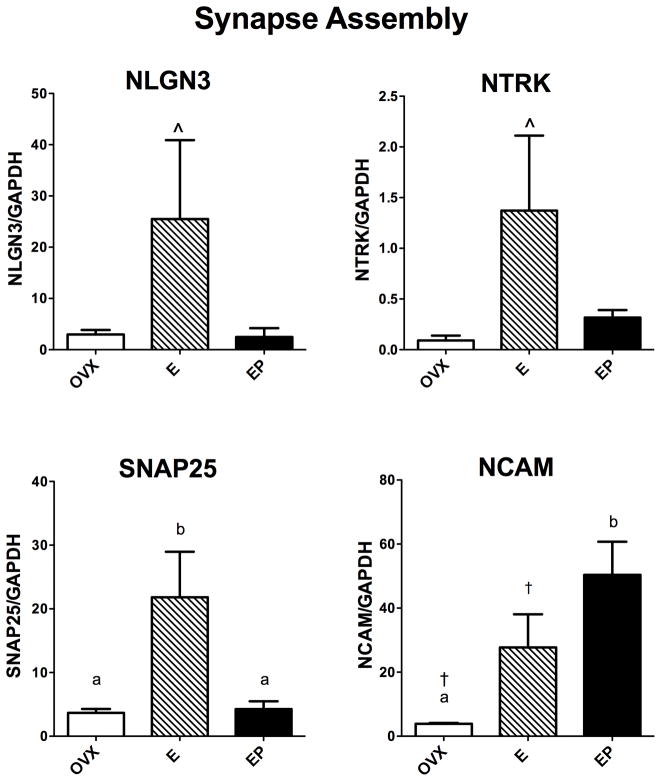
Figure 2.
Histograms illustrating the expression of 4 genes that are involved in synapse assembly. NGLN3 and NRK mRNAs showed a marked elevation with E treatment over placebo and E+P treatments, but neither increase reached statistical significance. SNAP25 mRNA was significantly increased by E over placebo or E+P treatments. NCAM mRNA was significantly increased by E with a t-test, and significantly increased by E+P treatment with ANOVA and the posthoc test.
a, b – groups with different letters are different at p<0.05 with Newman-Keuls posthoc pairwise comparison.
† - increased over placebo in Student’s t-test, p<0.05
^ - non-significant trend

