Fig. 2.

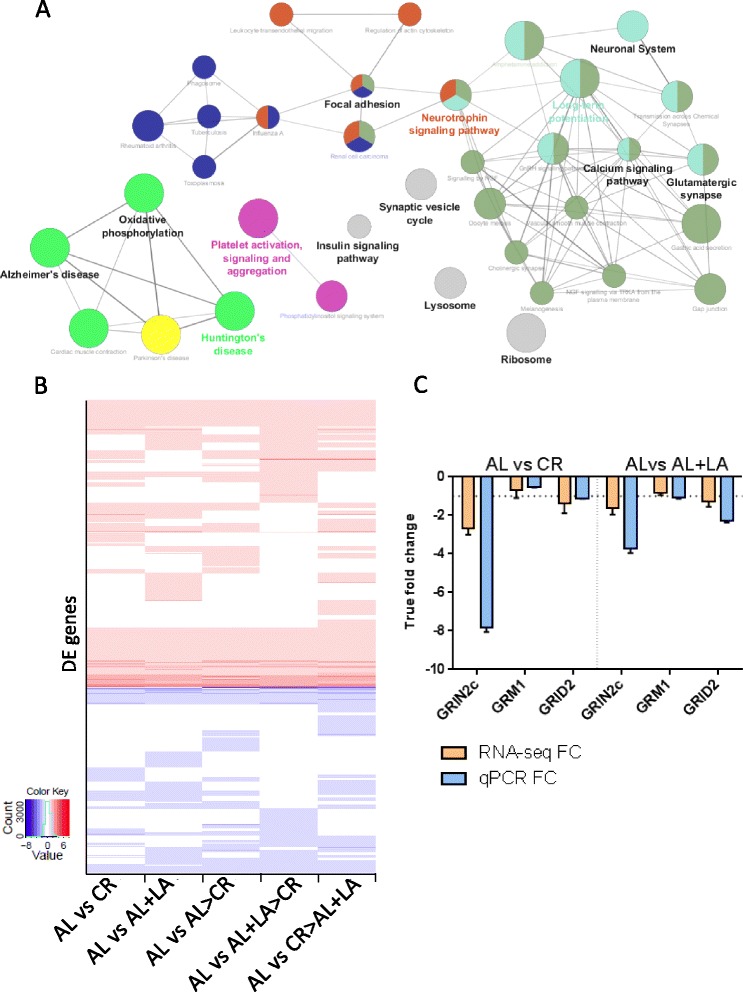
CR and LA supplementation elicit a similar neuroprotective gene expression profile. a Simplified networks of related statistically significant enriched GO terms using the Cytoscape add-on ClueGO [30, 31]. The network was made from the overlapping differentially expressed genes between all diets with CR and LA supplementation (a.k.a neuroprotective profile; see text for details). The Cytoscape add-on ClueGO allows enrichment analysis and the collapsing of GO terms into parent categories for each comparison. Each of the terms is statistically significant (Benjamini-Hochberg correction <0.05). The filled coloured circles (nodes) represent each statistically significant enriched parent GO term. The lines (edges) between the nodes show that there are overlapping genes within terms. The different sizes of the nodes relate to how many genes fall into the terms. b Heatmap of the differentially expressed genes (Table 1) across all diets with CR and LA supplementation when compared with AL; created in R using the heatmap3 package. Red = up-regulated, blue = down-regulated, log2 FC reported for statistically significant DE genes. White means no statistically significant change in expression. c Quantitative PCR confirmation of RNA-seq results, showing glutamate receptor differential expression (GRIN2c, GRM1 and GRID2) when comparing CR (left) and AL supplemented with LA (right) with AL alone. Orange bars are RNA-seq FC and blue bars are qPCR FC. The horizontal dotted line represents the one FC cutoff. The vertical dotted line separates the CR and LA supplemented comparisons. Error bars represent the standard error calculated for log2 FC as follows: (Standard error/Mean) × log2e. Hprt1, B2m and Ywhaz were used as reference genes. N = 6 per group, unpooled RNA from the RNA-seq experiment
