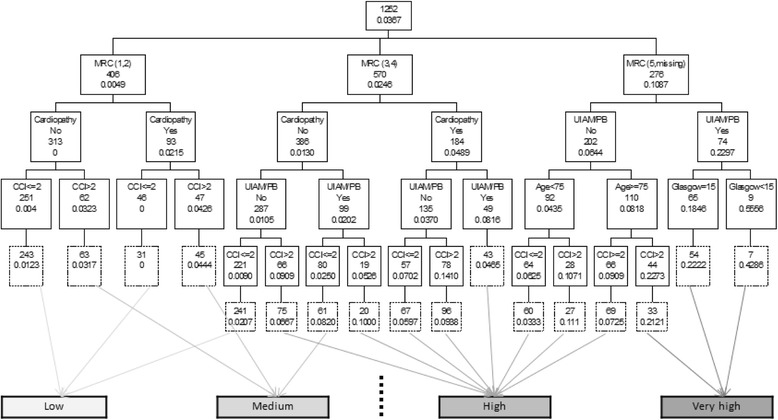
Fig. 3.

CART model for 60-day mortality in the derivation sample. Application to the validation sample is shown below each node in dashed boxes. Each node shows the classification variable plus the number of subjects and the estimated probability of 60-day mortality on that node. Estimated 60-day mortality risk has been categorized in low, medium, high and very high as show below the tree. Dashed vertical line shows the cut-off point for dichotomization of estimated mortality risk looking for optimal sensitivity-specificity combination in the derivation sample, leading to a sensitivity of 0.662 and a specificity of 0.823. UIAM = Use of inspiratory accessory muscle; PB = Paradoxical breathing; MRC = MRC breathlessness scale; CCI = Charlson Comorbidity Index
