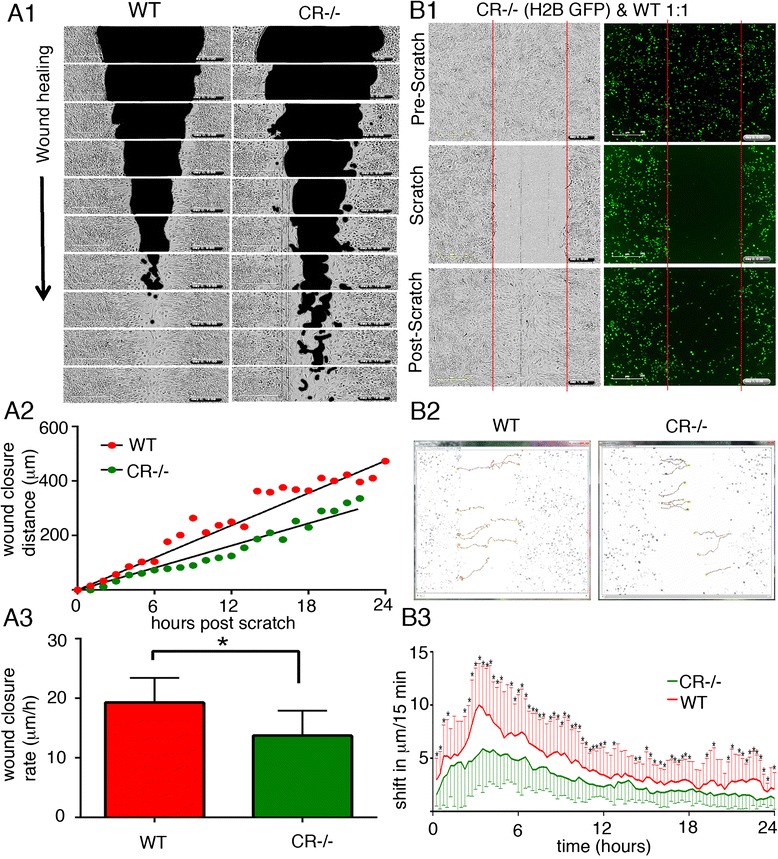
Fig. 4.

a1 Time-lapse brightfield images were taken after a scratch (black area) was made at t = 0 in a confluent layer (grey area) of prMC from WT and CR−/− mice. Images were taken every 2 hours and “wound closure” was measured as the rate at which the scratched area (black) was repopulated with mesothelial cells (grey zone). a2 The wound closure distance as a function of time resulted in the rate of cell re-colonization (“wound closure rate”: slope); a representative example for WT and CR−/− prMC is shown. a3 Quantitative analyses yielded closure rates of 19.3 ± 4.1 μm/h (mean ± S.D.) for WT and 13.7 ± 4.2 μm/h for CR−/− prMC (8–10 independent experiments per genotype; *p < 0.05; t-test) (b1) A scratch was made in a confluent layer initially consisting of non-fluorescent (black) WT cells and H2B - GFP-labeled CR−/− cells at a ratio of 1:1. The pre-scratch situation is depicted in the upper panel (brightfield image: left; GFP fluorescence (right). After complete gap closure, the initially void region was mostly filled (invaded) by non-fluorescent WT cells. b2 Measurement of cell mobility of single mesothelial cells (n = 10 cells per genotype) shows significant differences (*p < 0.05 two tailed t-test) in the mobility of WT and CR−/− cells quantified in (b3), where the cell movement was measured (in μm) per 15 min time interval
