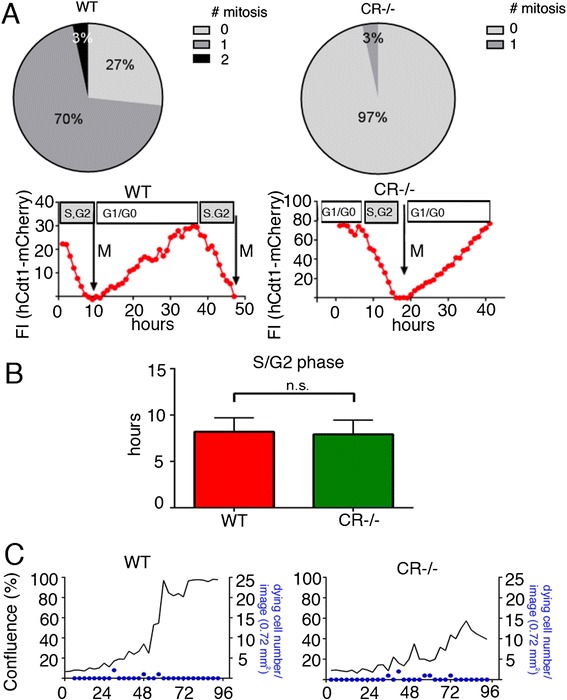
Fig. 5.

a During a 24 h observation period 70 % of WT prMC undergo mitosis (Mit1), 3 % of cells even 2 mitosis (Mit2) compared to CR−/− cells, where only 3 % of cells undergo mitosis (n = 30 cells per genotype). b Cell-cycle dependent changes in hCdt1-mCherry fluorescence monitored in prMC from WT and CR−/− mice. While the length of the S/G2/M phase is similar in both genotypes, the slower proliferation rate in CR−/− cells is the result of a prolonged G0/G1 phase. Signals are from 8 cells per genotype. Quantification of the S/G2/M phase in WT and CR−/− cells (bars represent means + SD; n = 10 cells per genotype). c Overlay of the real-time cell proliferation curves (black lines) and the density of dying cells (blue) in WT (left) and CR−/− (right) cell cultures. The blue dots display the number of newly emerging dying cells
