Figure 1.
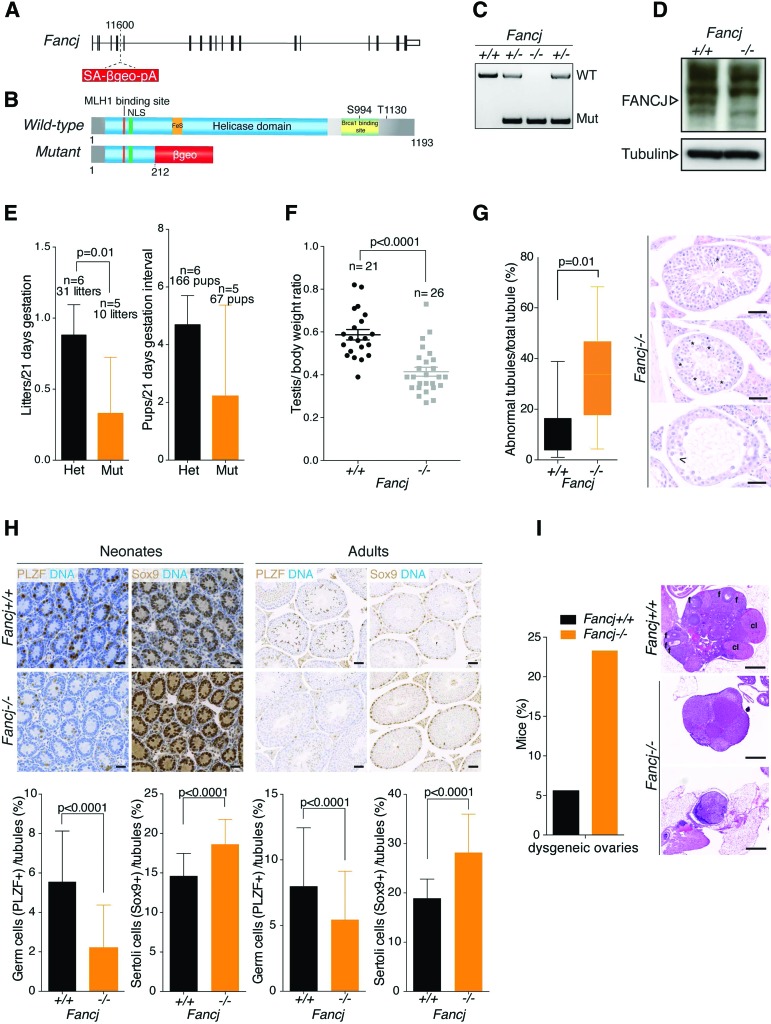
Germ cell attrition and subfertility in Fancj knockout mice. (A) Schematic representation of the mouse Fancj genomic locus. The pGT0Lxf gene trap vector is inserted at position 11600. The whole genomic locus is 143.06 kb, and introns (lines) and exons (bars) are represented to scale. (B) FANCJ protein organization. Note that the Fancj mutant protein is truncated at 212 amino acids and fused with the β-geo cassette of the gene trap vector. (C) Fancj PCR genotyping strategy. (D) Western blot on Fancj+/+ and Fancj−/− MEF lysates. The arrow indicates the FANCJ protein. Note that FANCJ is not expressed in Fancj−/− cells. Tubulin was used as loading control. (E) Fertility comparison between Fancj heterozygous and mutant breedings. Each pair bred during 5–6 mo, and the number of litters and pups per litter was quantified per 21-d gestation. Significance: t-test, litter per 21 d gestation, P = 0.01; pups per 21 d gestation, P = 0.08. (F) Fancj testis weights. Each testis weight was normalized against mice body weight. Significance: t-test, P < 0.0001. (G, left) Abnormal seminiferous tubule quantification on Fancj testis sections. (Right) Representative Fancj−/− seminiferous tubule images are shown. The Fancj−/− testis contains both normal tubules and also different levels of atrophic tubules. The bottom picture shows a severely atrophic tubule with almost no spermatogenic cells remaining. Asterisks show tubule degeneration. Bars, 50 µm. Significance: t-test, P = 0.01. (H, top) Five-day-old neonate and adult seminiferous tubules stained with PLZF (germ cells; brown) and Sox9 (sertoli; brown) markers. DNA is counterstained with hematoxylin (blue). Bars, 50 µm. (Bottom) Spermatogonia and sertoli cell quantification per tubule. Error bars represent ±standard error of the mean (SEM) of at least 50 tubules. Significance: with t-test, P < 0.0001. (I, left) Dysgeneic ovary frequency. n = 43 Fancj−/−; n = 18 Fancj+/+. (Right) Representative images of dysgeneic ovaries. Bars, 500 µm. (f) Follicles; (cl) corpus luteum. Significance: Fisher's exact test, P = 0.1.

