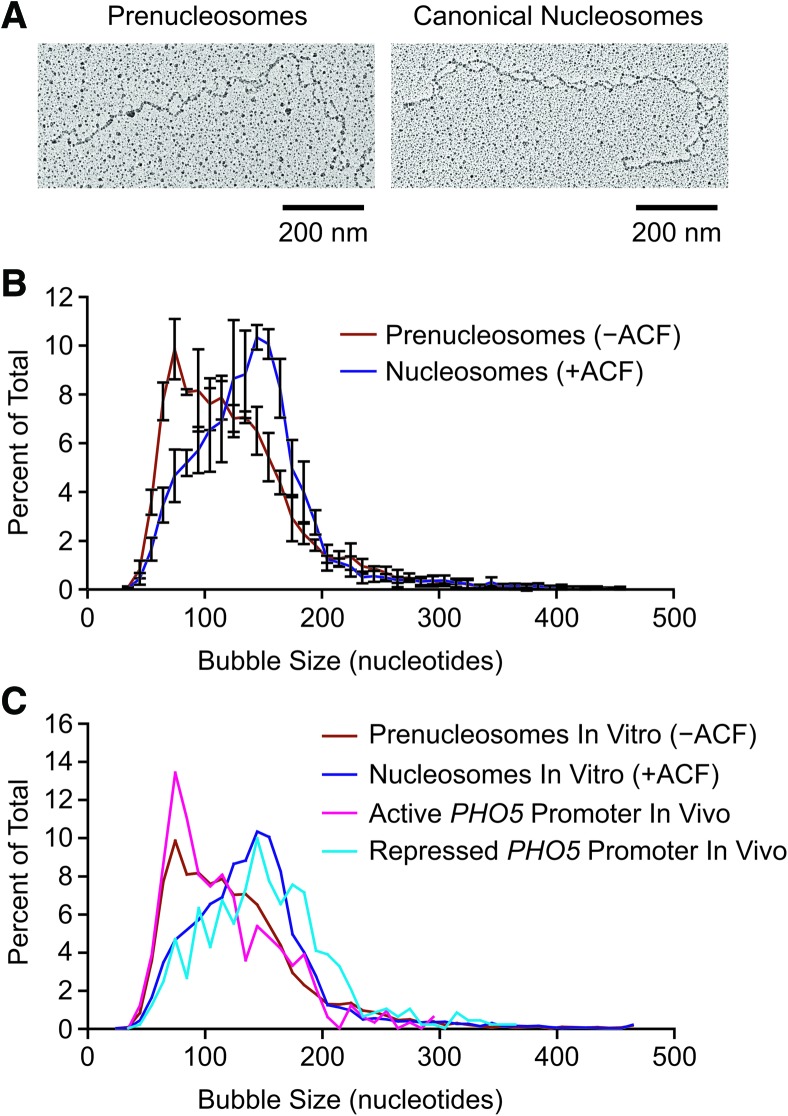
Figure 1.
Psoralen cross-linking and electron microscopy analysis suggests that prenucleosomes associate with ∼70–80 bp of DNA. (A) Analysis of prenucleosomes and nucleosomes by psoralen cross-linking followed by denaturing electron microscopy. Representative images are shown. The histone-free DNA is cross-linked by psoralen, and the resulting bubbles represent the locations of prenucleosomes and nucleosomes. (B) ACF-mediated conversion of NAP1-assembled prenucleosomes to canonical nucleosomes increases the size of psoralen bubbles from ∼70–80 nt to ∼140–150 nt. Prenucleosomes (−ACF) and nucleosomes (+ACF) were subjected to psoralen cross-linking and denaturing electron microscopy. Bubble sizes were measured in ImageJ and converted from nanometers to nucleotides. A total of 4623 prenucleosome bubbles and 5013 nucleosome bubbles was measured in four independent experiments. The plot displays the distribution of bubble sizes as the average ± standard deviation (n = 4) of 10-nt bins. The individual data points are placed at the center of the 10-nt bins. (C) Comparison of the psoralen bubble sizes observed in vitro and in vivo. The data from prenucleosomes and nucleosomes in vitro (shown in B) and at the active versus repressed PHO5 promoters in vivo in Saccharomyces cerevisiae (Brown et al. 2013). The plot shows the distribution of bubble sizes as the average of 10-nt bins.

