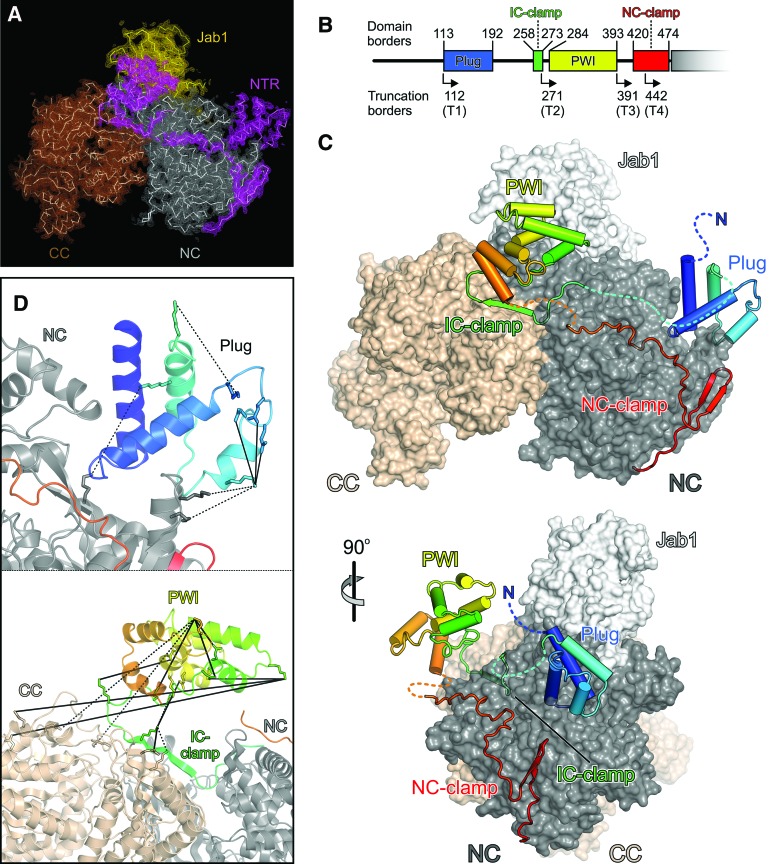
Figure 1.
Structure of a FL Brr2–Jab1 complex. (A) Simulated annealing composite omit map covering the NTRs (magenta), N-terminal cassette (NC; gray), C-terminal cassette (CC; brown), and Jab1 (gold) in the FL Brr2–Jab1 crystal structure contoured at the 1.0 σ level. Molecular models are shown as ribbons. (B) Scheme of the NTR organization. Numbers above the scheme provide the domain borders, and angled arrows and numbers below the scheme indicate the starting positions of the NTR truncation variants of yeast Brr2. (C) Orthogonal views of the FL Brr2–Jab1 complex structure showing a ribbon of the NTR on the surface of the helicase cassettes and Jab1. The NTR is colored blue to red from the N terminus to the C terminus, the N-terminal cassette is colored dark gray, the C-terminal cassette is beige, and Jab1 is light gray. (D) Close-up views of the plug and IC clamp/PWI region of the NTR (magenta) showing cross-links identified in isolated Brr2. (Solid lines) Zero-length cross-links observed with 4-(4,6-dimethoxy-1,3,5-triazin-2-yl)-4-methylmorpholinium chloride (DMTMM); (dashed lines) cross-links observed with bis(sulfosuccinimidyl) suberate (BS3). The image is rotated 10° to the left about the vertical axis (top panel) and 45° to the top about the horizontal axis (bottom panel) compared with the top panel in B.

