Figure 3.
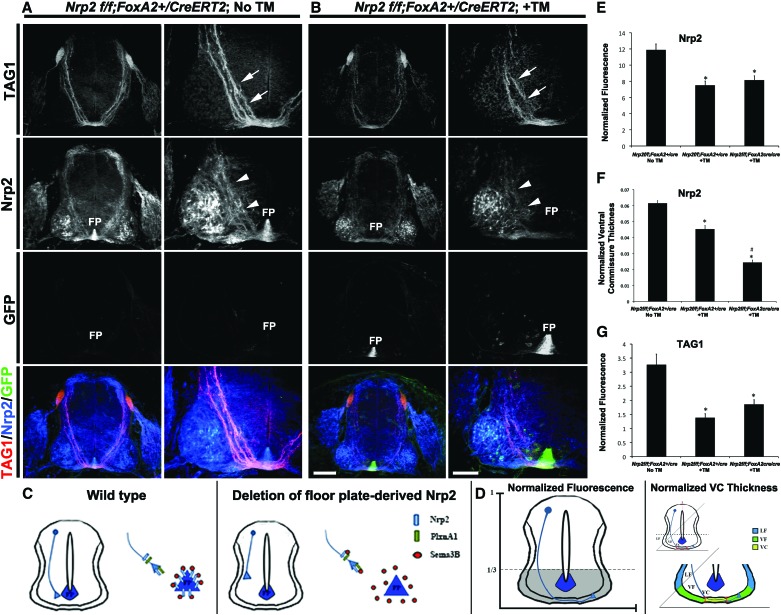
Specific deletion of floor plate-derived Nrp2 revealed precrossing guidance defects in Nrp2-positive commissural axons. (A,B) Representative confocal images of E11.5 spinal cord sections were taken from a Nrp2f/f;FoxA2+/CreERT2 embryo with no TM treatment (No TM; A) or a Nrp2f/f;FoxA2-+/CreERT2 embryo with TM treatment (+TM; B). All transverse sections were processed for immunocytochemistry for TAG1 (red), Nrp2 (blue), and GFP (green). Bars: in left column of B (for A,B) (low magnification), 160 µm; in right column of B (high magnification), 80 µm. White arrows and white arrowheads point to TAG1+ and Nrp2+ axons, respectively. (FP) Floor plate. Nrp2f/f; FoxA2CreERT2/CreERT2 +TM embryos were analyzed, and images are shown in Supplemental Figure 3. (C) Schematic diagrams of E11.5 spinal cords illustrating many fewer dorsal Nrp2+ precrossing axons failing to reach the most ventral one-third of the cord and midline when Nrp2 expression is specifically deleted from the floor plate. (D) Schematic diagrams illustrating the parameters for the measurements of the normalized immunofluorescence (left side) and the normalized ventral commissure thickness (right side) (see the Materials and Methods). (E) Quantifications of Nrp2-normalized fluorescence in Nrp2f/f;FoxA2+/CreERT2 No TM, Nrp2f/f;FoxA2+/CreERT2 +TM, and Nrp2f/f; FoxA2CreERT2/CreERT2 +TM embryos. Data are means ± SEM from five to six sections per embryo, where n = 5 embryos per genotype. ANOVA followed by post-hoc Tukey test, (*) P < 0.05 compared with Nrp2f/f;FoxA2+/CreERT2 No TM. (F) Quantifications of Nrp2-normalized ventral commissural thickness from Nrp2f/f;FoxA2+/CreERT2 No TM, Nrp2f/f;FoxA2+/CreERT2 +TM, and Nrp2f/f;FoxA2CreERT2/CreERT2 +TM embryos. Data are means ± SEM from five to eight sections per embryo, where n = 8 embryos for Nrp2f/f;FoxA2+/CreERT2 No TM; Nrp2f/f;FoxA2+/CreERT2 +TM; n = 7 embryos for Nrp2f/f;FoxA2CreERT2/CreERT2 +TM. ANOVA followed by post-hoc Tukey test, (*) P < 0.05 compared with Nrp2f/f;FoxA2+/CreERT2 No TM; (#) P < 0.05 compared with Nrp2f/f;FoxA2+/CreERT2 +TM. (G) Quantifications of TAG1-normalized fluorescence in Nrp2f/f;FoxA2+/CreERT2 No TM, Nrp2f/f;FoxA2+/CreERT2 +TM, and Nrp2f/f;FoxA2CreERT2/CreERT2 +TM embryos. Data are means ± SEM from five to six sections per embryo, where n = 5 embryos for Nrp2f/f;FoxA2+/CreERT2 No TM; n = 3 embryos for Nrp2f/f;FoxA2+/CreERT2 +TM; Nrp2f/f;FoxA2CreERT2/CreERT2 +TM. ANOVA followed by post-hoc Tukey test, (*) P < 0.05 compared with Nrp2f/f;FoxA2+/CreERT2 No TM.

