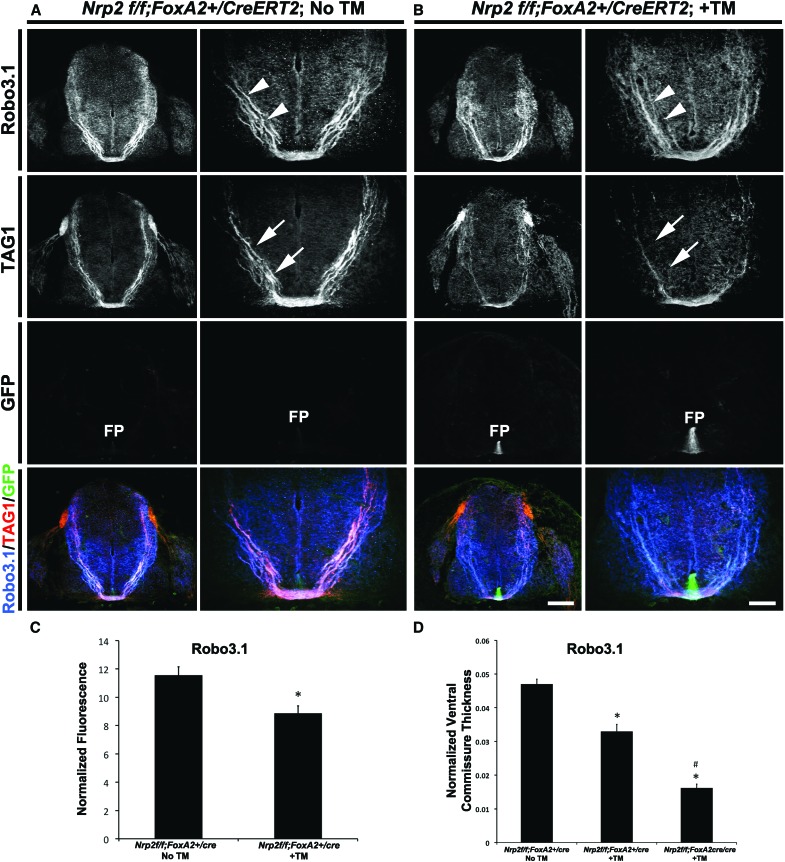
Figure 4.
Specific deletion of Nrp2 from the floor plate shows precrossing guidance defects in a subset of Robo3.1-positive commissural axons. (A,B) Representative confocal images of E11.5 spinal cord sections taken from a Nrp2f/f;FoxA2+/CreERT2 embryo with no TM treatment (No TM; A) or a Nrp2f/f;FoxA2+/CreERT2 embryo with TM treatment (+TM; B). All transverse sections were processed for immunocytochemistry for Robo3.1 (blue), TAG1 (red), and GFP (green). Bars: A, left column of B (low magnification), 160 µm; right column of B (high magnification), 80 µm. White arrowheads and white arrows point to Robo3.1+ and TAG1+ axons, respectively. (FP) Floor plate. (C) Quantifications of Robo3.1-normalized fluorescence in Nrp2f/f;FoxA2+/CreERT2 No TM and Nrp2f/f;FoxA2+/CreERT2 +TM embryos. Data are means ± SEM from five to eight sections per embryo, where n = 3 embryos per genotype. Student's t-test, (*) P < 0.05. (D) Quantifications of Robo3.1-normalized ventral commissural thickness in Nrp2f/f;FoxA2+/CreERT2 No TM, Nrp2f/f;FoxA2+/CreERT2 +TM, and Nrp2f/f;FoxA2CreERT2/CreERT2 +TM embryos. Data are means ± SEM from five to eight sections per embryo, where n = 4 embryos for Nrp2f/f;FoxA2+/CreERT2 No TM; n = 3 embryos for Nrp2f/f;FoxA2+/CreERT2 +TM; Nrp2f/f;FoxA2CreERT2/CreERT2 +TM. ANOVA followed by post-hoc Tukey test, (*) P < 0.05 compared with Nrp2f/f;FoxA2+/CreERT2 No TM; (#) P < 0.05 compared with Nrp2f/f;FoxA2+/CreERT2 +TM. Ventral spinal commissural axons that are known to express GAD65 were analyzed, and images, including quantifications, are shown in Supplemental Figure 5.

