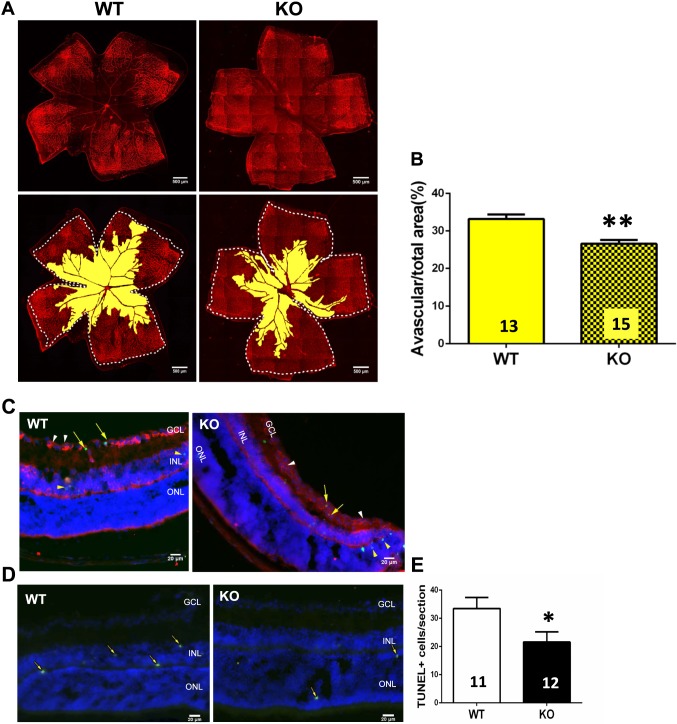
Figure 3.
Genetic deletion of A1Rs reduced hypoxia-induced retinal vascular regression and cellular apoptosis at P12. (A) Retinal blood vessels of both WT and KO groups were visualized by isolectin B4 staining of whole-mount retinas at P12 of OIR. The whole retinal surface is shown by white dotted line. Avascular area is indicated as yellow. Scale bar: 500 μm. (B) Avascular area (%) was quantified as a percentage of the whole retinal surface (n = 7 retinas from seven WT mice and n = 9 retinas from nine A1R KO mice). Data are presented as the mean ± SEM. *P < 0.05, Student's t-test. (C, D) The apoptotic cells in retinal cross-sections of WT and A1R KO mice were detected by TUNEL staining at P12 of OIR. TUNEL-positive cells are indicated by yellow arrows. TUNEL signals were detected mainly in INL and ONL layers of retina in both WT and A1R KO mice. Coimmunostaining of TUNEL and CD31 (a marker for endothelial cell) revealed that CD31+ cells (white arrowhead) were largely segregated from the TUNEL signal (yellow arrowhead) with little coimmunostaining of TUNEL/CD31 (yellow arrow). Scale bar: 20 μm. (E) The TUNEL-positive cells of WT and A1R KO groups were quantified. Data are presented as mean ± SEM. *P < 0.05 comparing A1R KO group with WT group (n = 6 retinas from six WT mice and n = 6 retinas from six A1R KO mice).

