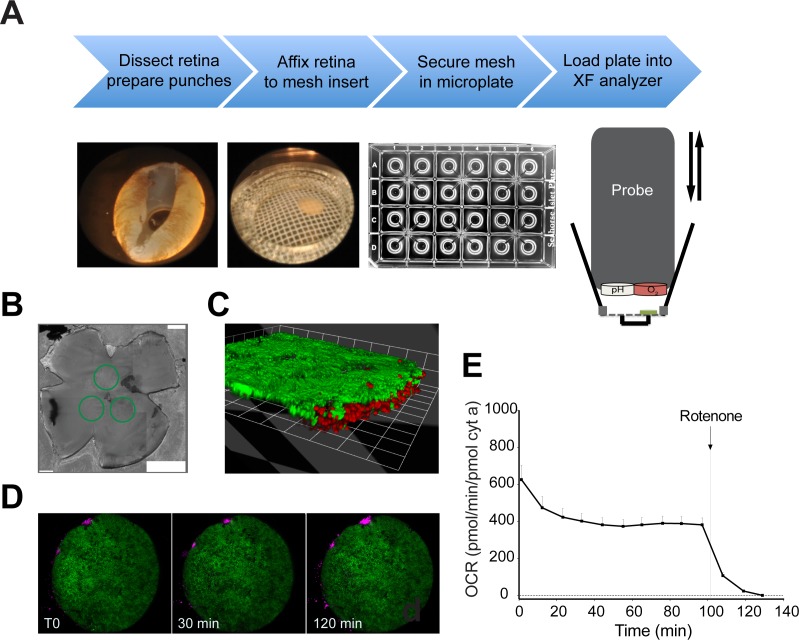
Figure 1.
(A) Workflow illustrating the preparations steps (top), dissected whole retina with one punched area, 1-mm retinal disc mounted on mesh insert, multiwell plate (Seahorse XF24 Analyzer; Seahorse Bioscience), and a schematic of the measurement chamber (bottom). A probe with O2 and CO2 (pH) fluorophore detectors is cyclically lowered and raised to each well of a 24-multiwell plate. (B) Green circles drawn on retinal flat mount highlight position from where discs were excised. (C, D) Samples of Nrlp-GFP retina stained with propidium iodide and imaged over the time interval of a typical assay. (E) Basal OCR recorded for 130 minutes to assess stability of the measurement throughout the assay. Values are normalized to cytochrome a content. The arrow indicates the time at which rotenone (1 μM final concentration) was added to the sample well. n = 15 retinal samples from 3 to 4 mice. Error bars: SEM.

