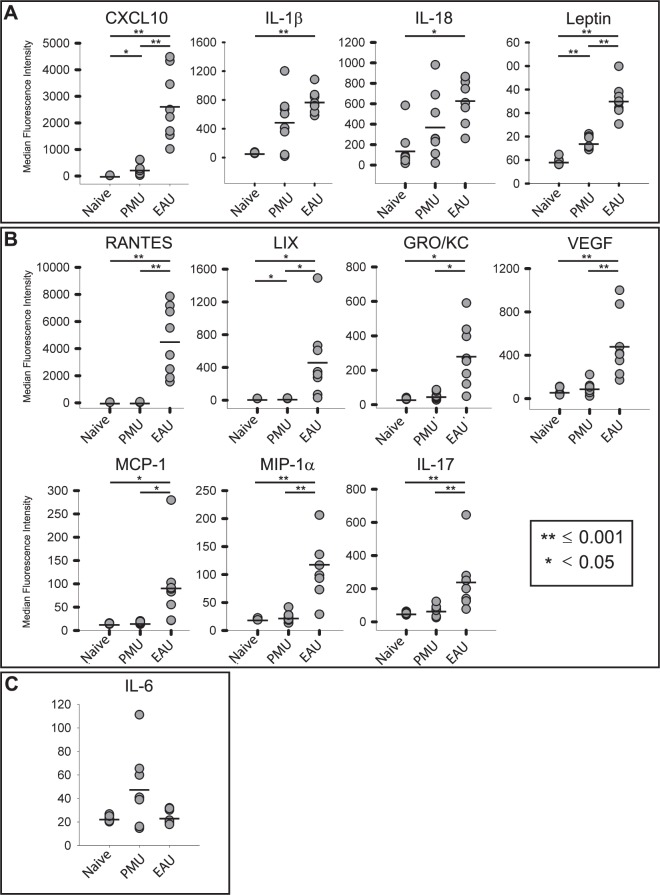
Figure 3.
Comparison of highly-induced proinflammatory cytokines in the aqueous. Aqueous was collected from PMU naïve, PMU, and EAU eyes. Cytokine levels are expressed in MFI. The MFI from each sample is represented as a gray circle. The bar represents the mean MFI. (A) Cytokines with >1.5-fold induction in both PMU and EAU. (B) Cytokines with >1.5-fold induction in EAU only. The LIX levels in PMU were significantly elevated (P = 0.03), but with only 1.1-fold induction. (C) Interleukin-6 is only induced in PMU (2.1-fold, P = 0.13). Significant differences are indicated by *P < 0.05 and **P ≤ 0.001. Nonsignificant differences are not indicated. Cytokine levels are expressed in MFI.

