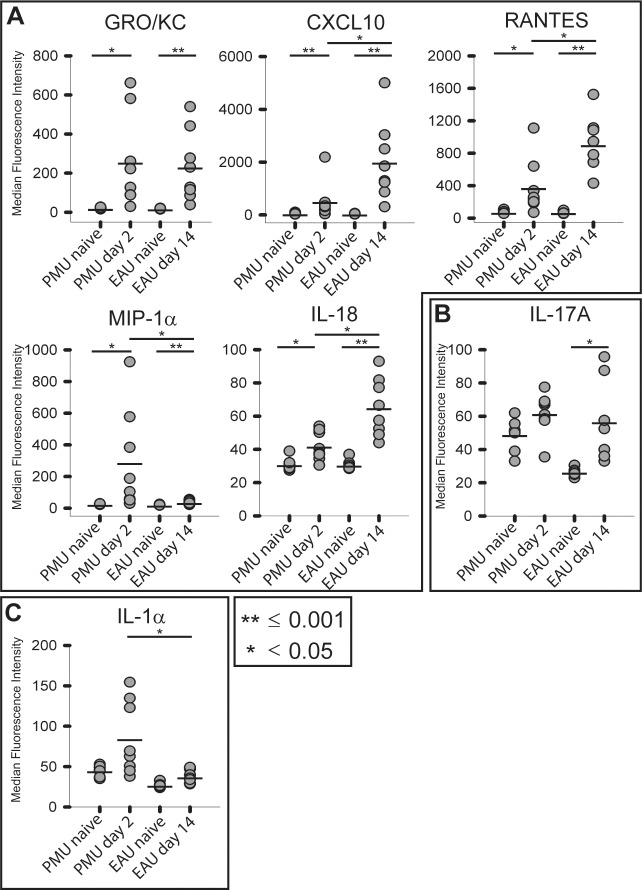
Figure 4.
Comparison of highly-induced proinflammatory cytokines in the vitreous. Vitreous was collected from PMU naïve, PMU, and EAU eyes. Cytokine levels are expressed in MFI. The MFI from eight animals per condition is represented as a gray circle. The bar represents the mean MFI. (A) Cytokines with >1.5-fold induction in both PMU and EAU. Interleukin-18 in PMU was only elevated 1.4-fold, but this was significant (P = 0.02) (B) Interleukin-17 was induced 2.1-fold in EAU only (P = 0.01). (C) Interleukin-61α was induced in PMU (1.9-fold, P = 0.11). Significant differences are indicated by *P < 0.05 and **P ≤ 0.001. Nonsignificant differences are not indicated.

