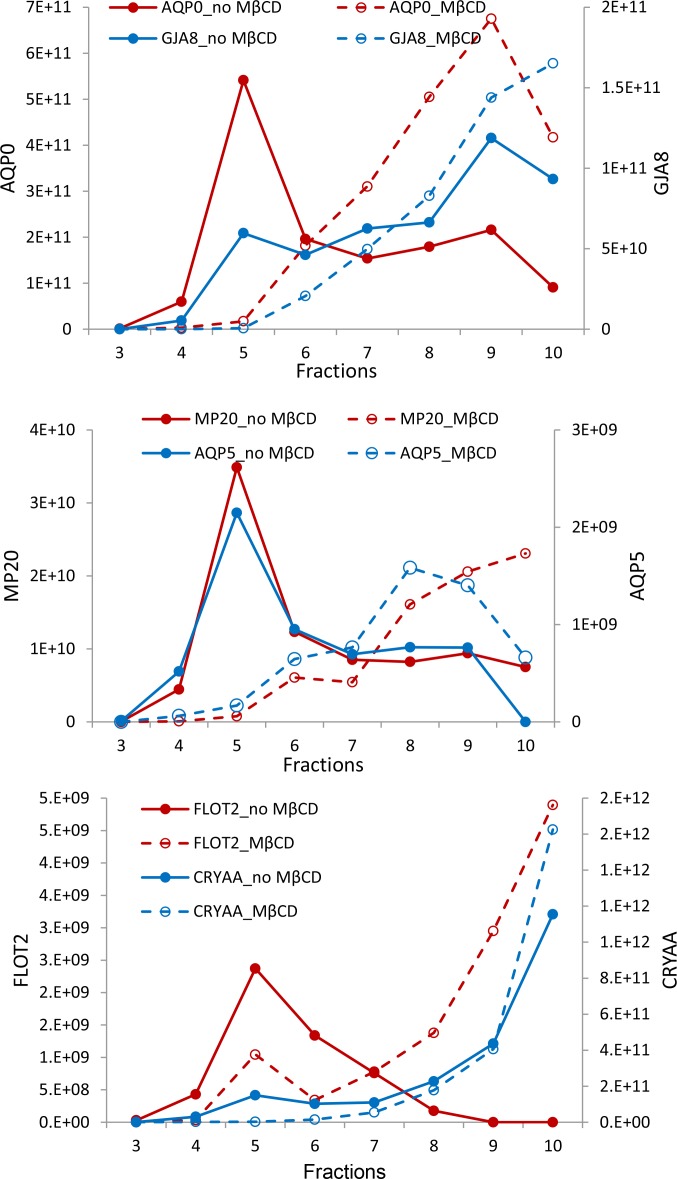
Figure 5.
Distribution of some major lens proteins across the sucrose density gradient and effects of MβCD treatment. Proteins in each fraction were digested by trypsin and analyzed by LC-MS/MS as described in the Materials and Methods section. Protein abundance was represented as the peak area of one peptide. Total peak area corresponding to proteins from 100 μL each fraction was calculated and plotted. The y-axis shows the peak areas of corresponding peptides.

