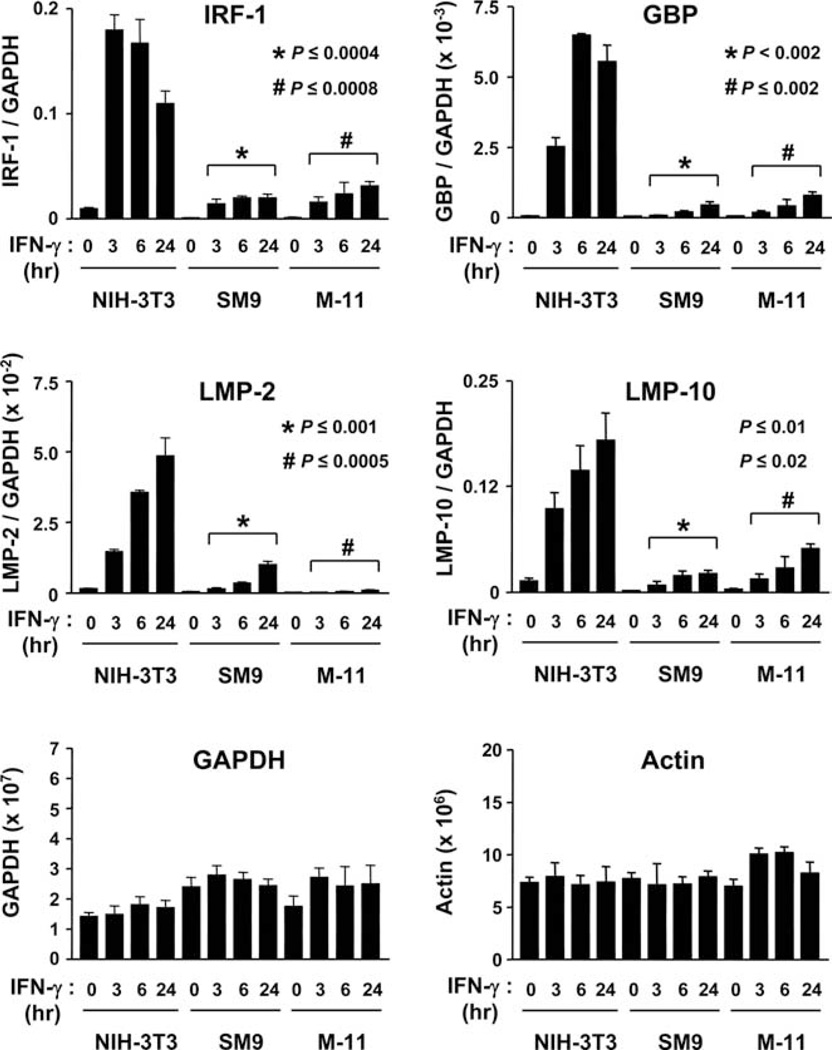
FIGURE 2.
Kinetic analysis of IFN-γ-inducible gene expression in mouse TBCs. RNA was isolated from NIH-3T3, SM9, and M-11 cells exposed to 500 U/ml IFN-γ for 0, 3, 6, and 24 h and subjected to SYBR Green-based quantitative RT-PCR using primers specific for IRF-1, GBP, LMP-2, LMP-10, GAPDH, and actin. Relative copy number from 20 ng of RNA of each cell type was determined by generating a standard curve using known amounts of plasmids containing the respective cDNAs of the genes examined. The data are the average of four independent experiments and are represented as the ratio of the relative mRNA expression of each gene (i.e., IRF-1) vs GAPDH. Unpaired Student’s t test was used to compare the relative levels of IFN-γ-inducible gene expression in NIH-3T3 cells vs SM9 and M-11 cells that were exposed to IFN-γ for the same duration.

