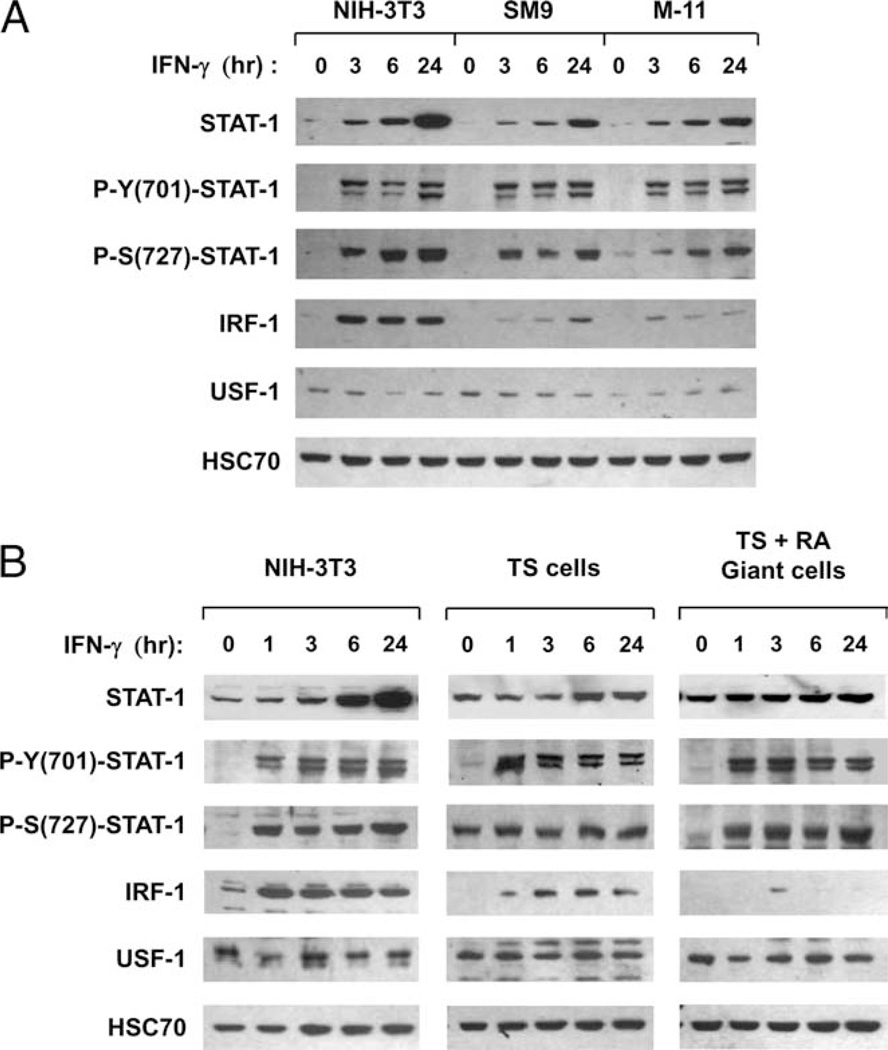
FIGURE 5.
Examination of IFN-γ-induced transcription factors pSTAT-1 and IRF-1 expression in mouse TBCs. A, WCE were isolated from NIH-3T3, SM9, and M-11 cells exposed to 500 U/ml IFN-γ for 0, 3, 6, and 24 h and subjected to SDS-PAGE and WB analyses, using Abs specific for STAT-1p91, phosphotyrosine (701)-STAT-1, phosphoserine (727)-STAT-1, and IRF-1. The blots were stripped and reprobed with Abs for USF-1 and HSC70 as a control for loading and the integrity of the protein extracts. WB analysis was performed on at least four independent preparations of WCE from each cell type, and the figure is representative of the data from all experiments. B, WCE from TS cells and trophoblast giant cells exposed to 500 U/ml IFN-γ for 0, 1, 3, 6, and 24 h were subjected to WB analyses, as described in A. Representative data from three independent preparations of WCE are shown in this figure.

