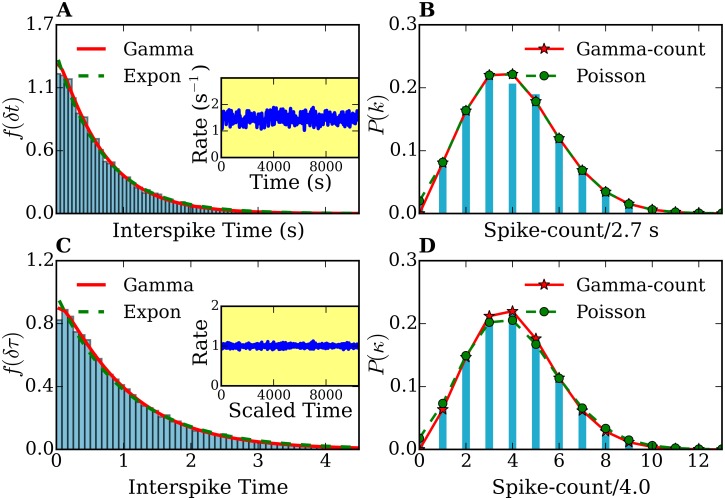
Fig 6. Interspike-time and frequency-count histograms of a simulation of free Brownian vesicles.
(A), (C) Interspike-time histograms f(δt) and f(δτ) before and after time rescaling, respectively. (B), (D) frequency-count histograms P(k) (for a time interval of T = 2.7 s width) and P(κ) (for a rescaled time interval of width) before and after time rescaling, respectively. The histograms f(δt) and f(δτ) are fitted with gamma (solid lines) and exponential distributions (dashed lines). The frequency-count histograms P(k) and P(κ) are fitted with the gamma-count- (see text, solid lines) and Poisson distributions (dashed lines). The number of spikes was 15504. Inset plots in (A) and (C) show the spike rates of the original and time rescaled spike series, respectively.

