Fig 8.
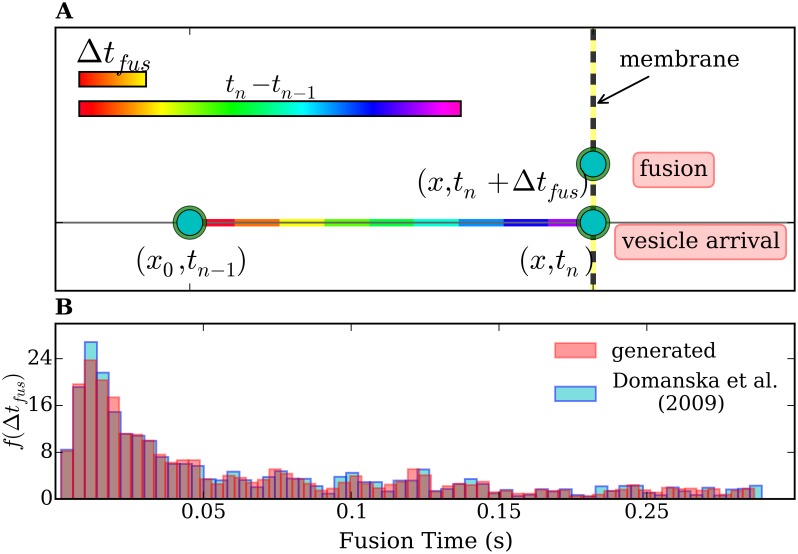
(A) Projection of the trajectory of the vesicle responsible for the n th event on the axis perpendicular to the membrane. At the time t n − 1, which refers to the (n − 1)th event, the vesicle is at a distance x 0 from the membrane. The vesicle arrives at the membrane at time t n and releases at time t n + Δt fus. A difference in the time scale of the priming/fusion reaction and the transport process is shown in the color bars. (B) Normalized frequency histogram f(Δt fus) (number of fusion events vs Δt fus) taken from Ref. [35] (blue) and the normalized frequency histogram of our generated Δt fus (pink), for comparison. The time scale for fusion Δt fusion (see x-axis) is at least one order of magnitude smaller than t n − t n − 1 (see previous figures). The difference in the time scales is schematically represented by the color bars in A.

