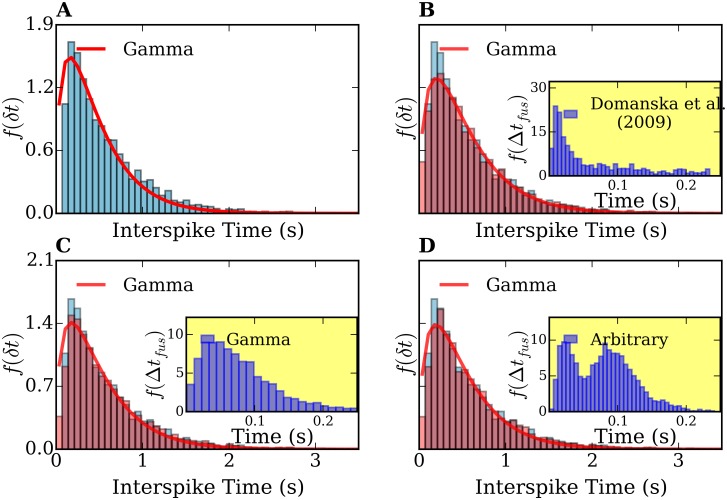
Fig 10. Comparison of interspike-time histograms computed from simulations of diffusive vesicles under an attractive harmonic potential and considering different fusion-time distributions.
(A) Interspike-time histogram of a simulation without the fusion times, i.e., setting Δt fus = 0. (B),(C),(D) show the histograms assuming f(Δt fus) from Ref. [35], a gamma distribution, and an arbitrary distribution, respectively. Inset plots in (B),(C),(D) show the assumed lag-time distributions.

