
Fig 1.
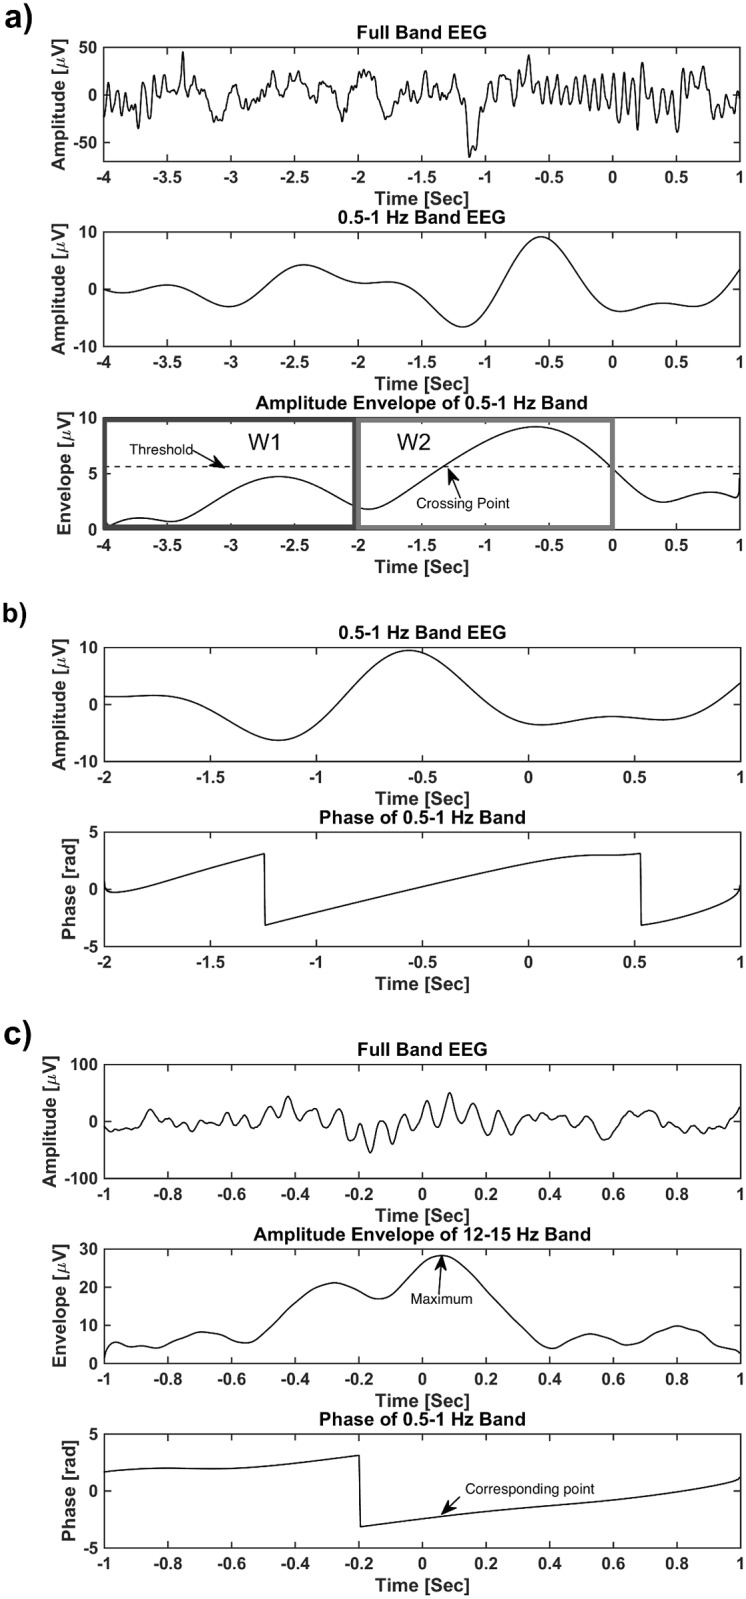
(a): Identification of spindle/SO complexes. Mean, μ, and standard deviation, σ, of the amplitude envelope of slow oscillations is calculated via the Hilbert transform in the reference window (W1) to build a threshold as T = μ +2*σ. Then the amplitude envelope of slow oscillations was measured in a pre-spindle window (W2) to determine the presence of above-threshold slow oscillations that occurred prior to the spindle. (b): Phase of a sample signal in 0.5–1 Hz frequency band. (c): Phase of slow oscillations, provided by Hilbert transform, at the maximum of the spindle amplitude envelope.