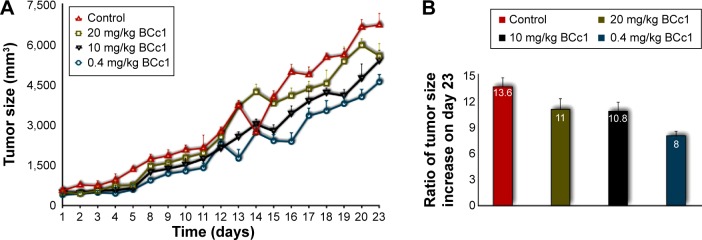
Figure 8.
BCc1 tumor suppressing effect (A). Ratio of tumor size on the day 23 in relation to day 1 in the control and test groups (B).
Notes: The tumor size from each group at the end of the experiment (day 23) was divided over the tumor size from each group in the beginning of the treatment (day 1) to demonstrate the efficacy of the nanocomplex in controlling tumor growth by using mathematical logic.

