
Figure 3.
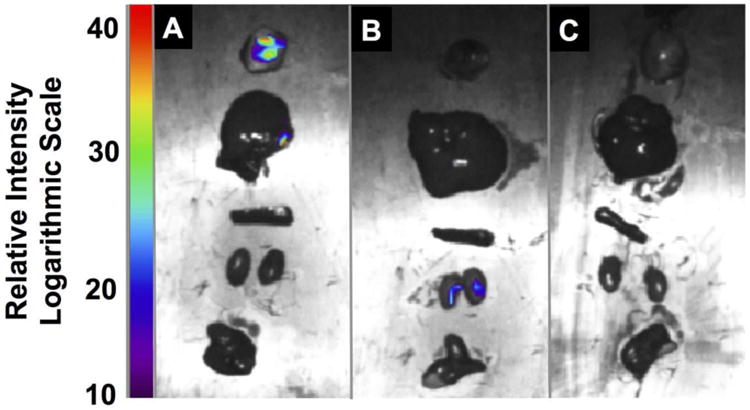
Ex vivo tissue analysis. Fluorescence imaging of A) NPL B) NPD and C) saline cohorts at 14 days post-IV injection. Organs were imaged immediately after excision, and include tumor, liver, spleen, kidneys, heart, and lung, from top to bottom in each panel.