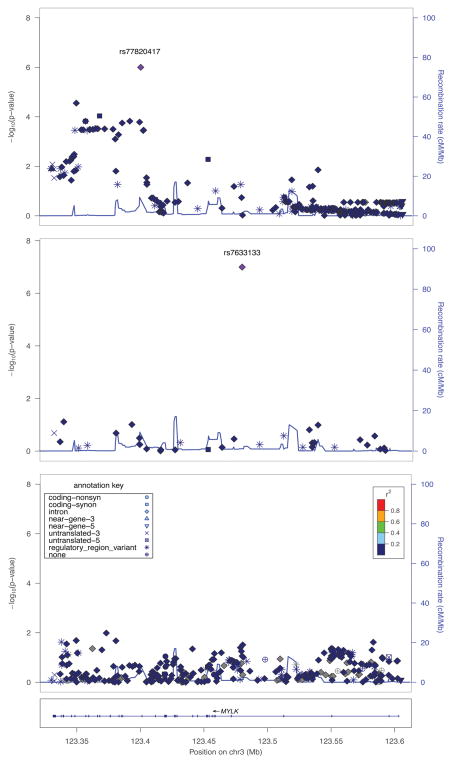
Figure 1. Regional plots of association results in the discovery sample (upper panel), GABRIEL (middle panel), and EVE (lower panel).
The -log10 transformed p-values for association tests are plotted as symbols according to their functional annotation. The SNP rs number indicated on the plot denotes the result for the most significantly associated SNP with asthma risk. The results for the remaining SNPs are color coded to reflect their degree of linkage disequilibrium with the most significant SNP based on pairwise r2 values from the European population of the 1KGP. Estimated recombination rates (light blue line) are plotted on the right y-axis.

